


这是中高级诊断课程第4课,前面重点讲了sga的关键结构,比如Buffer cache,shared pool等,实际上其中还有一个经常被大家所忽视的一个结构;那就是large pool。
老规矩,在开始讲解large pool之前,这里我们先分享一下诊断群学员刚出炉的一个案例。
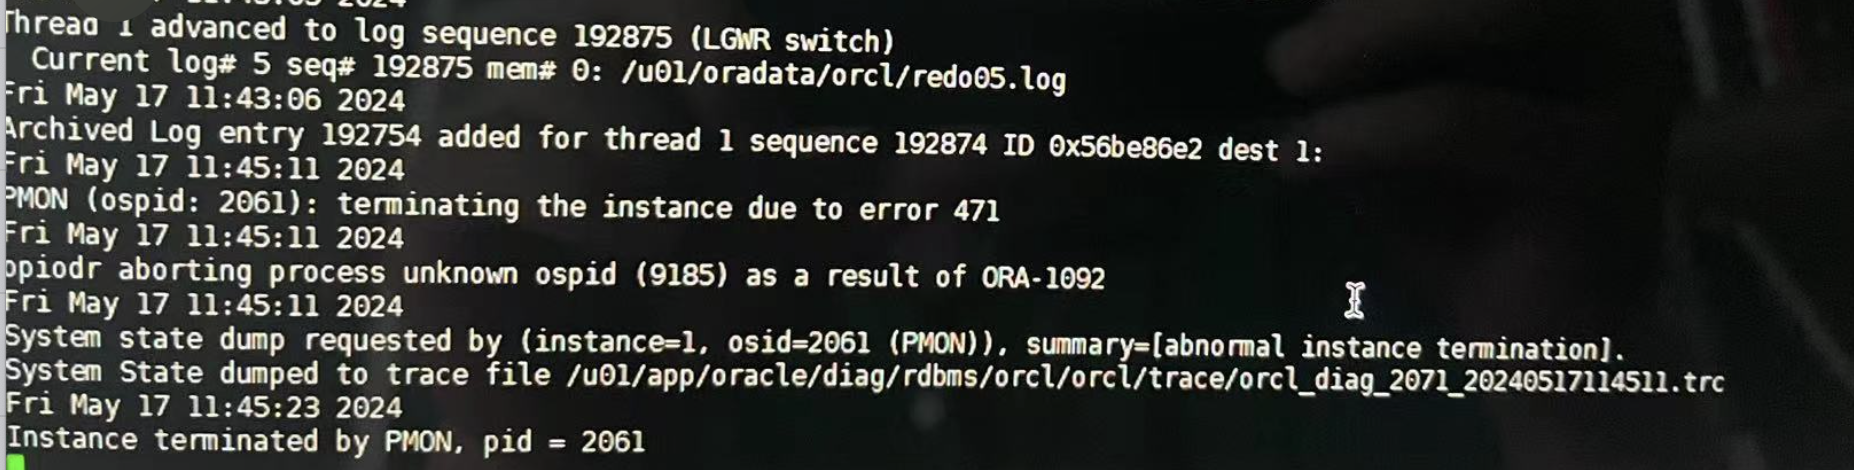
看上去在11:45:23左右,pmon进程直接将数据库实例crash了,此时产生了一个system state dump。
我们来看看这个状态dump的主要内容:
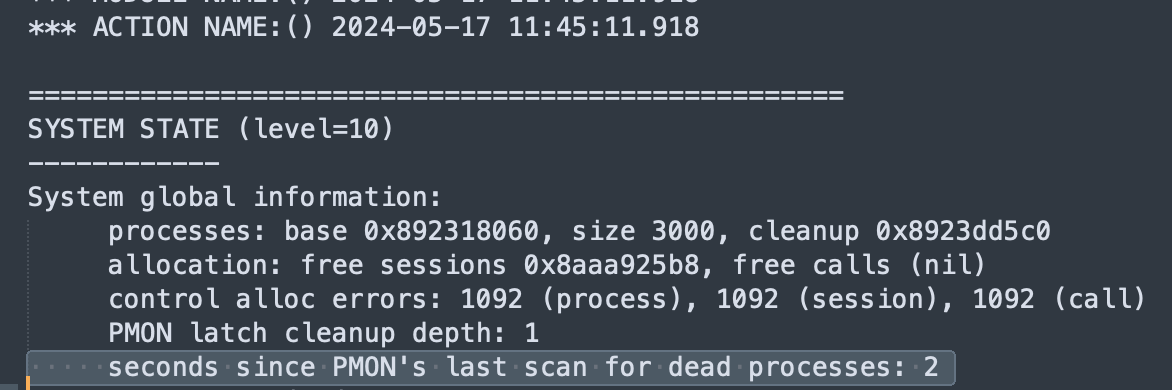
由此可以看出pmon进程发现了死进程,而该进程很可能是个核心进程,因此pmon 进程cleanup 死进程,数据库就crash了。这里我们直接搜索DEAD关键字:
PROCESS 10: DBW0
  ----------------------------------------
  SO: 0x8923e18a0, type: 2, owner: (nil), flag: INIT/-/-/0x00 if: 0x3 c: 0x3
   proc=0x8923e18a0, name=process, file=ksu.h LINE:12721, pg=0
  (process) Oracle pid:10, ser:1, calls cur/top: 0x89450e660/0x89450e660
            flags : (0x7) DEAD
            flags2: (0x0),  flags3: (0x10)
            intr error: 0, call error: 0, sess error: 0, txn error 0
            intr queue: empty
    ksudlp FALSE at location: 0
    Cleanup details:
      Found dead = 10 sec ago                  -----显示10秒之前已经死掉了
      Total Cleanup attempts = 0, Cleanup time = 0 sec, Cleanup timer = 0.000 sec
  (post info) last post received: 0 0 26
              last post received-location: ksa2.h LINE:285 ID:ksasnd
              last process to post me: 0x8aa45fef0 1 6
              last post sent: 0 0 152
              last post sent-location: kcbb.h LINE:2261 ID:kcbbza
              last process posted by me: 0x8923e2958 1 6
    (latch info) wait_event=0 bits=0x0
    Process Group: DEFAULT, pseudo proc: 0x8aaa814b8
    O/S info: user: oracle, term: UNKNOWN, ospid: 2079 (DEAD)
    OSD pid info: Unix process pid: 2079, image: oracle@db-1 (DBW0)
......
......
    ----------------------------------------
    SO: 0x893427360, type: 4, owner: 0x8923e18a0, flag: INIT/-/-/0x00 if: 0x3 c: 0x3
     proc=0x8923e18a0, name=session, file=ksu.h LINE:12729, pg=0
    (session) sid: 1134 ser: 1 trans: (nil), creator: 0x8923e18a0
              flags: (0x51) USR/- flags_idl: (0x1) BSY/-/-/-/-/-
              flags2: (0x409) -/-/INC
              DID: , short-term DID:
              txn branch: (nil)
              edition#: 0              oct: 0, prv: 0, sql: (nil), psql: (nil), user: 0/SYS
    ksuxds FALSE at location: 0
    service name: SYS$BACKGROUND
    Current Wait Stack:
     0: waiting for 'rdbms ipc message'
        timeout=0x12c, =0x0, =0x0
        wait_id=830509 seq_num=44092 snap_id=1
        wait times: snap=13.922218 sec, exc=13.922218 sec, total=13.922218 sec
        wait times: max=3.000000 sec, heur=13.922218 sec
        wait counts: calls=1 os=1
        in_wait=1 iflags=0x5a8
    Wait State:
      fixed_waits=0 flags=0x22 boundary=(nil)/-1
    Session Wait History:
        elapsed time of 0.375152 sec since current wait
     0: waited for 'rdbms ipc message'
        timeout=0x11f, =0x0, =0x0
        wait_id=830508 seq_num=44091 snap_id=1
        wait times: snap=2.871548 sec, exc=2.871548 sec, total=2.871548 sec
        wait times: max=2.870000 sec
        wait counts: calls=1 os=1
        occurred after 0.000123 sec of elapsed time
     1: waited for 'db file async I/O submit'
        requests=0xe, interrupt=0x0, timeout=0x0
        wait_id=830507 seq_num=44090 snap_id=1
        wait times: snap=0.126313 sec, exc=0.126313 sec, total=0.126313 sec
        wait times: max=infinite
        wait counts: calls=0 os=0
        occurred after 0.000429 sec of elapsed time
     。。。。。。
     。。。。。。
     7: waited for 'db file async I/O submit'
        requests=0x8, interrupt=0x0, timeout=0x0
        wait_id=830501 seq_num=44084 snap_id=1
        wait times: snap=0.028439 sec, exc=0.028439 sec, total=0.028439 sec
        wait times: max=infinite
        wait counts: calls=0 os=0
        occurred after 0.000396 sec of elapsed time
     8: waited for 'rdbms ipc message'
        timeout=0x12c, =0x0, =0x0
        wait_id=830500 seq_num=44083 snap_id=1
        wait times: snap=3.001436 sec, exc=3.001436 sec, total=3.001436 sec
        wait times: max=3.000000 sec
        wait counts: calls=1 os=1
        occurred after 0.000071 sec of elapsed time
     9: waited for 'db file async I/O submit'
        requests=0x2, interrupt=0x0, timeout=0x0
        wait_id=830499 seq_num=44082 snap_id=1
        wait times: snap=0.001605 sec, exc=0.001605 sec, total=0.001605 sec
        wait times: max=infinite
        wait counts: calls=0 os=0
        occurred after 0.000180 sec of elapsed time
    Sampled Session History of session 1134 serial 1
    ---------------------------------------------------
    The sampled session history is constructed by sampling
    the target session every 1 second. The sampling process
    captures at each sample if the session is in a non-idle wait,
    an idle wait, or not in a wait. If the session is in a
    non-idle wait then one interval is shown for all the samples
    the session was in the same non-idle wait. If the
    session is in an idle wait or not in a wait for
    consecutive samples then one interval is shown for all
    the consecutive samples. Though we display these consecutive
    samples  in a single interval the session may NOT be continuously
    idle or not in a wait (the sampling process does not know).

    The history is displayed in reverse chronological order.

    sample interval: 1 sec, max history 120 sec
    ---------------------------------------------------
      [38 samples,                                         11:44:30 - 11:45:20]
        idle wait at each sample
      [1 sample,                                                      11:44:29]
        waited for 'db file async I/O submit', seq_num: 44057
          p1: 'requests'=0x37
          p2: 'interrupt'=0x0
          p3: 'timeout'=0x0
          time_waited: 0.048821 sec (sample interval: 0 sec)
      [8 samples,                                          11:44:21 - 11:44:28]
        idle wait at each sample
      [1 sample,                                                      11:44:20]
        waited for 'db file async I/O submit', seq_num: 44045
          p1: 'requests'=0x33
          p2: 'interrupt'=0x0
          p3: 'timeout'=0x0
          time_waited: 0.040640 sec (sample interval: 0 sec)
      [5 samples,
最低0.47元/天 解锁文章


 被折叠的 条评论
为什么被折叠?
被折叠的 条评论
为什么被折叠?
 到【灌水乐园】发言


