pyqt5使用pyqtgraph绘制多个Y值散点图 1、效果 2、代码 创建一个graph_scatter.py,用来布置画布: # -*- coding: utf-8 -*- # Form implementation generated from reading ui file 'graph_scatter.ui' # # Created by: PyQt5 UI code generator 5.15.4 # # WARNING: Any manual changes made to this file will be lost when pyuic5 is # run aga


 超级会员免费看

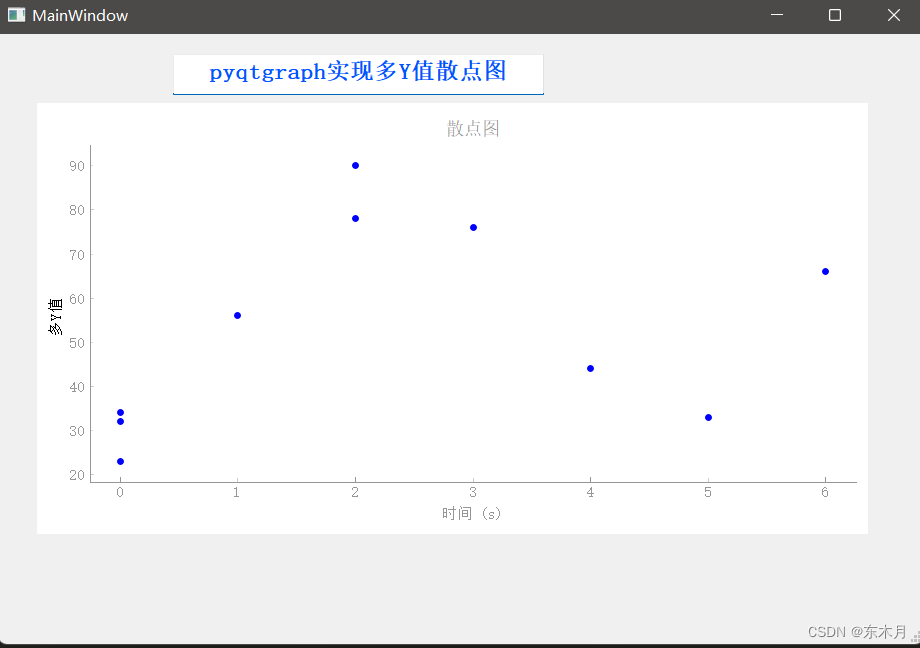
 本文介绍了如何在PyQt5应用中利用pyqtgraph库绘制多个Y值的散点图。首先展示了最终实现的效果,接着详细讲解了创建窗口及显示散点图的代码实现过程。

 订阅专栏 解锁全文


 1168
1168

 被折叠的 条评论
为什么被折叠?
被折叠的 条评论
为什么被折叠?
 到【灌水乐园】发言


