


立即学习:https://edu.youkuaiyun.com/course/play/24913/285858?utm_source=blogtoedu
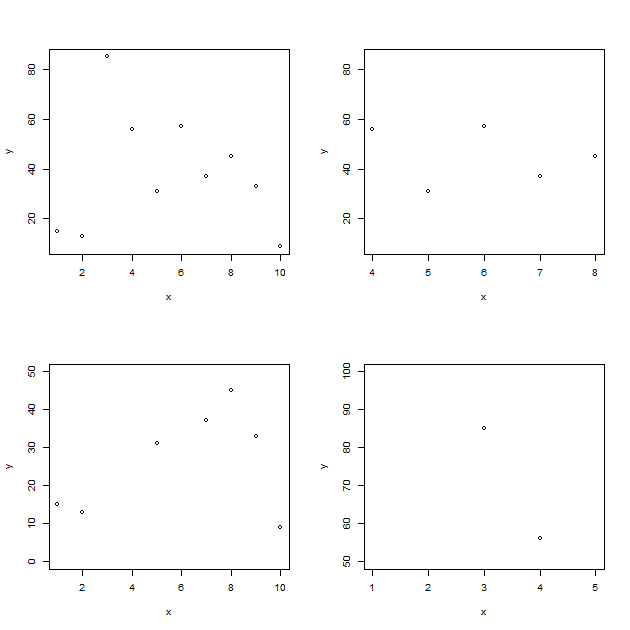
xlim和ylim参数
x = c(1:10)
y = sample(1:100, 10)
par(mfrow = c(2,2))
plot(x, y)
plot(x, y, xlim = c(4, 8))
plot(x, y, ylim = c(0, 50))
plot(x, y, xlim = c(1, 5), ylim = c(50, 100))
对应结果:


 892
892

 被折叠的 条评论
为什么被折叠?
被折叠的 条评论
为什么被折叠?
 到【灌水乐园】发言


