 深入理解Android内存泄漏及解决策略


 本文探讨了Android应用中内存泄漏的问题,特别是Fragment内存泄漏的原因。当Fragment的视图被销毁,但其自身仍然存在时,会导致内存泄漏。文章提到了Android Studio Profiler工具的使用,以及LeakCanary工具如何帮助定位和解决内存泄漏问题。通过在build.gradle中添加LeakCanary依赖,可以在Logcat中查看详细的泄漏信息,进而发现是由于未释放应用程序单例模块的监听器导致的内存泄漏。
现象:
通过AndroidStudio的Profiler工具,抓取堆栈信息后,得到内存泄漏的反馈
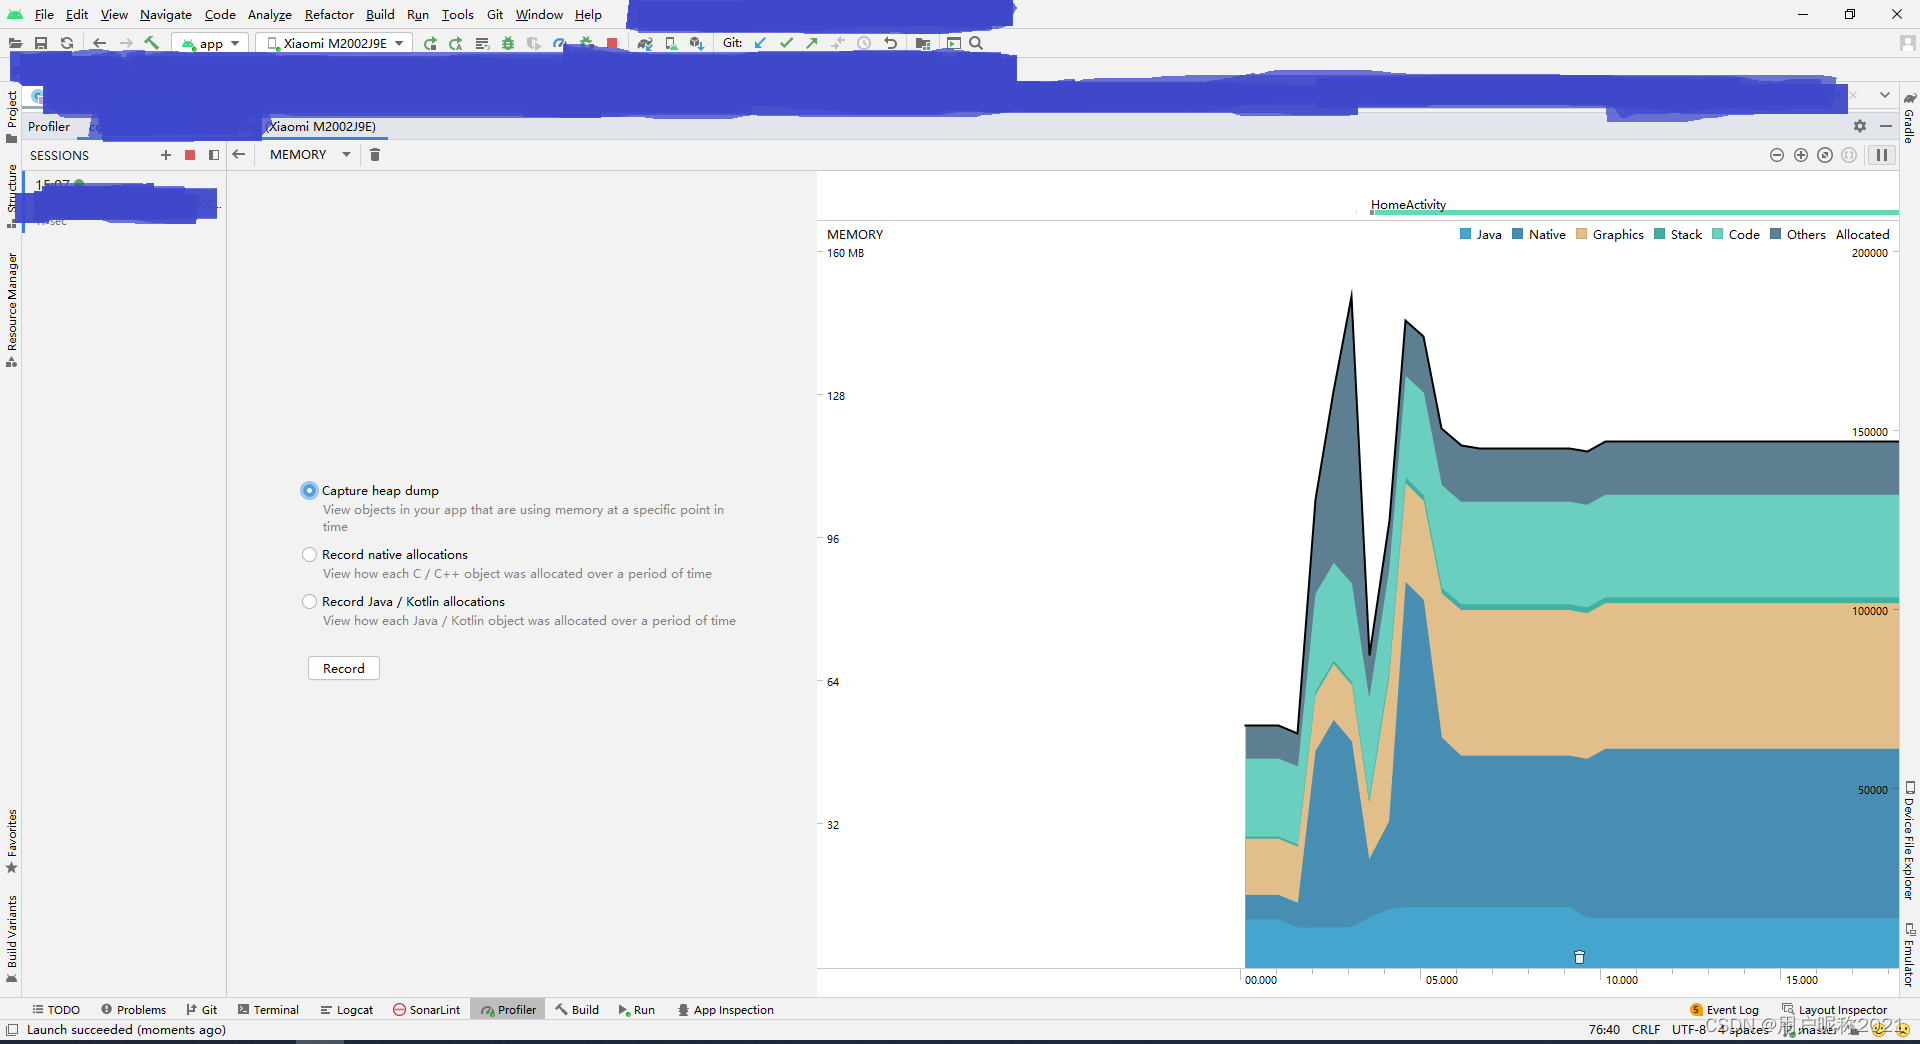
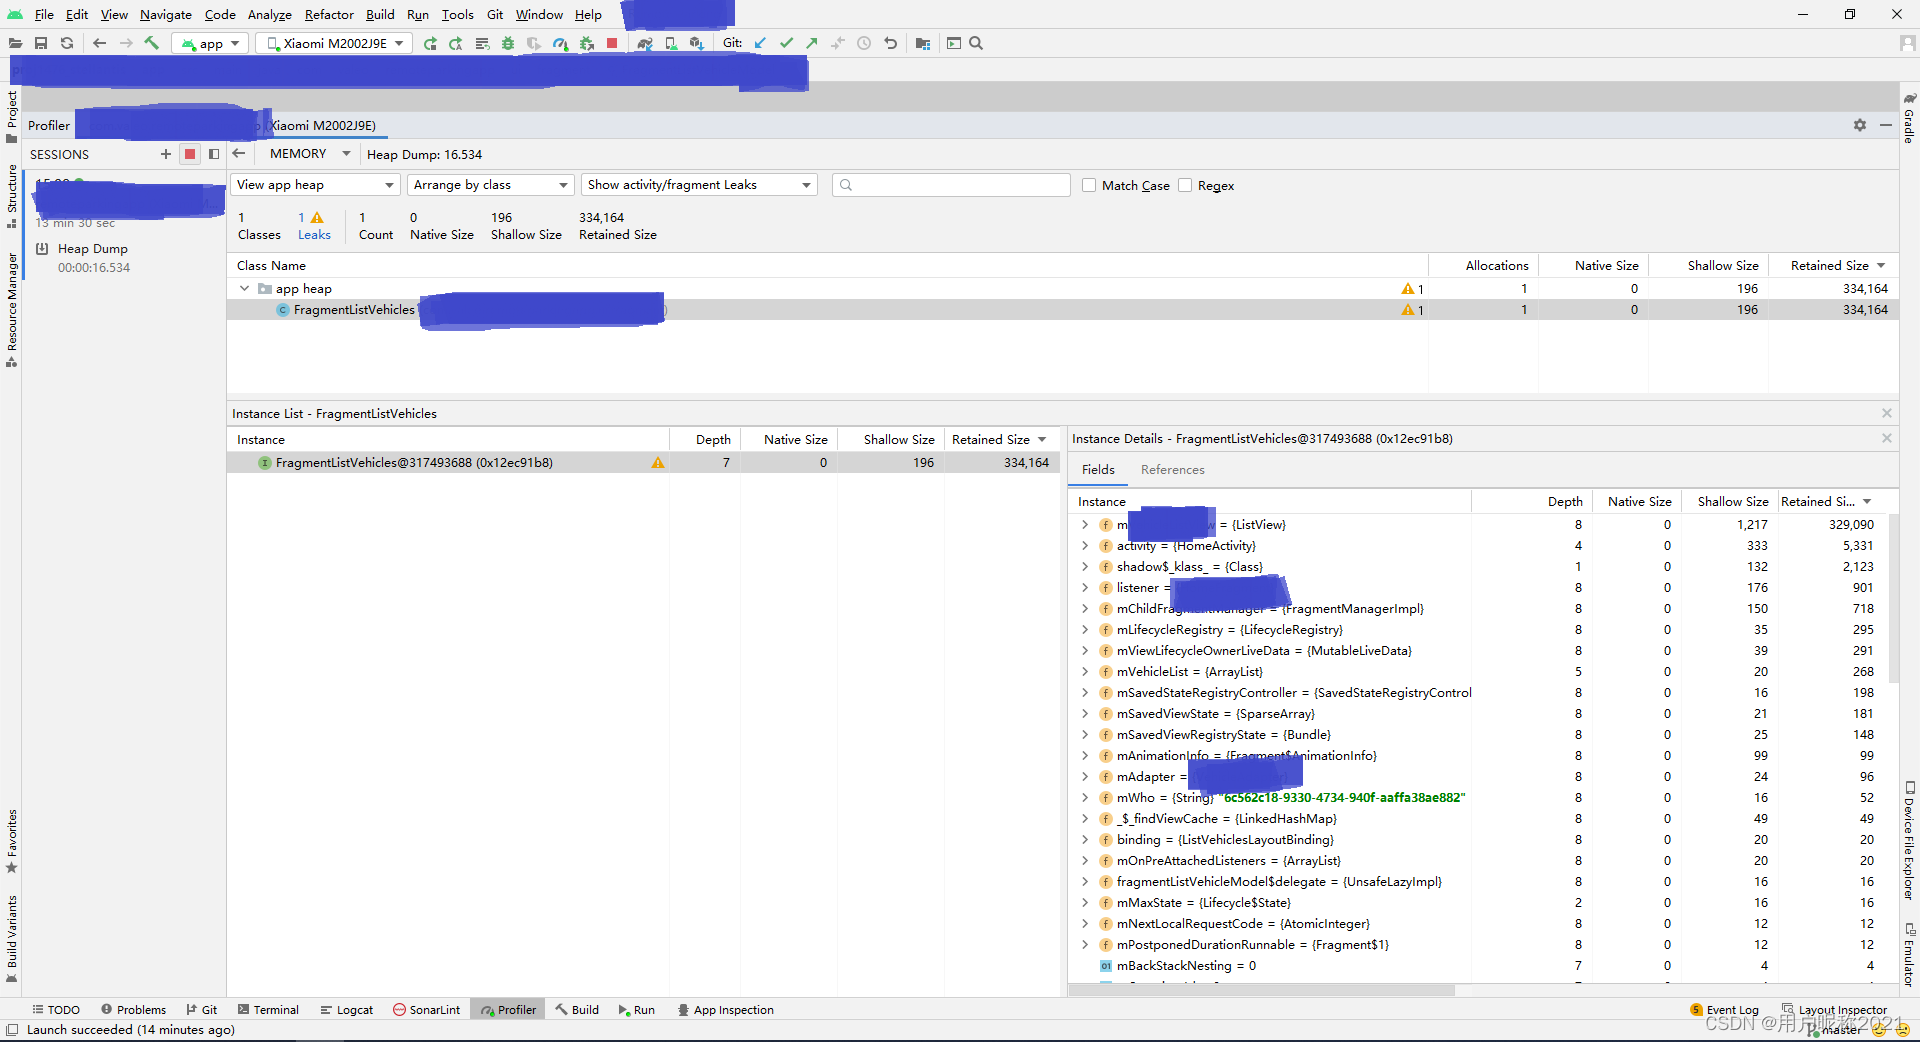
只知道是哪个文件泄漏了,但不知道什么原因导致的泄漏。
什么是内存泄漏?
一个对象用完后被毁掉了,但是他的引用还在,导致GC无法回收此对象占用的内存,于是导致内存泄漏。
A memory leak occurs when an object’s reference is held on to after its purpose has been served. As a result, this prevents the garbage collector from cleaning up the reference.
泄漏是怎么发生的?
How do leaks happen in fragments? First, we need to start by reviewing the important nuance of fragments. They have two different lifecycles:
It’s own lifecycle (onCreate and onDestroy)
It’s view’s lifecycle (onCreateView and onDestroyView)
Having two lifecycles for a single screen can be problematic. They are created and destroyed at different times, for instance, when putting a fragment on the back-stack. Specifically, holding onto views after onDestroyView is called will leak. This happens when a fragment is on the back stack, and although its view is destroyed, the fragment itself is not. The garbage collector is unable to clear the reference to those views.
链接:h
 最低0.47元/天 解锁文章


 1373
1373

 被折叠的 条评论
为什么被折叠?
被折叠的 条评论
为什么被折叠?
 到【灌水乐园】发言


