


背景:
在android开发中经常会有需求来分析一些内存问题,比如内存泄露,内存过大等,针对java相关的进程其实内存都还比较好定位,因为大家app开发时候都会经常使用Android Studio抓取hprof内存快照,然后与MAT工具结合起来一起分析定位内存泄露相关的问题。
但是native相关的内存分析有没有什么好的分析工具呢?今天来给大家分享一个Perfetto的native内存抓取分析功能。
使用实战
抓取native内存的配置方式
抓取方式1:
直接使用chrome浏览器在线抓取native相关内存,具体需要操作的4个步骤如下:
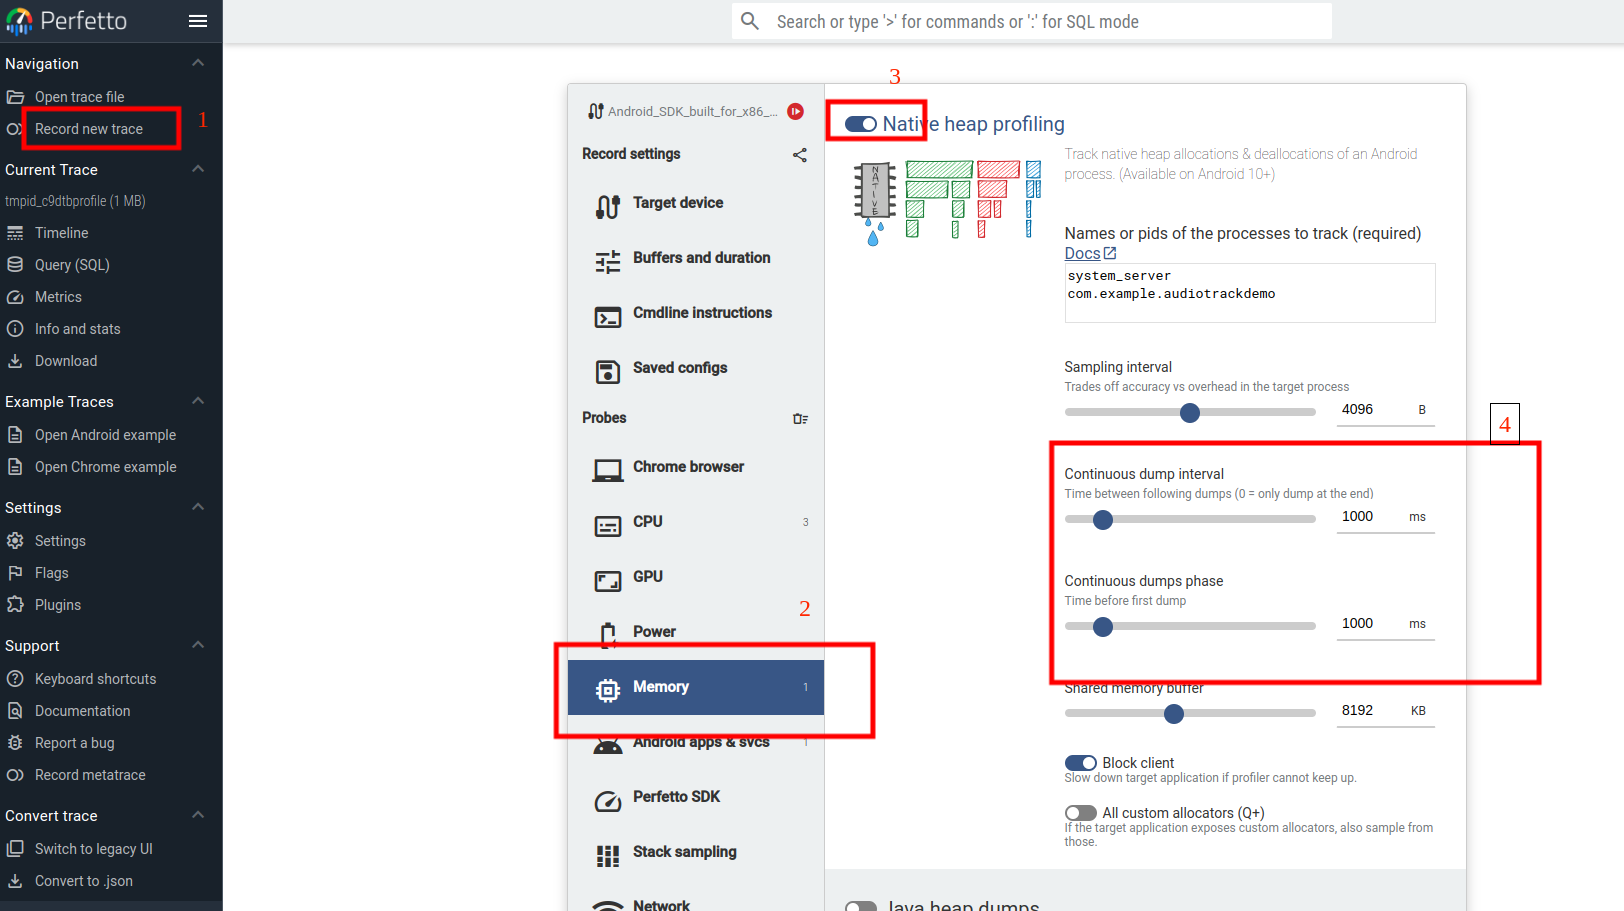 主要就是在配置record new trace的memory选项中需要放开Native heap profiling,这里需要注意的需要手动放开如下选项“Continuous dump interval”
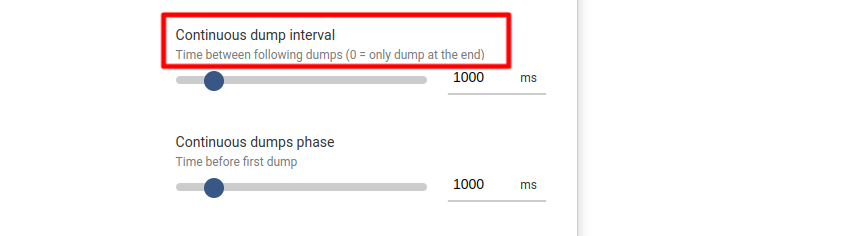 这里如果默认是0,那么就只会进行一次native 内存的dump采样。
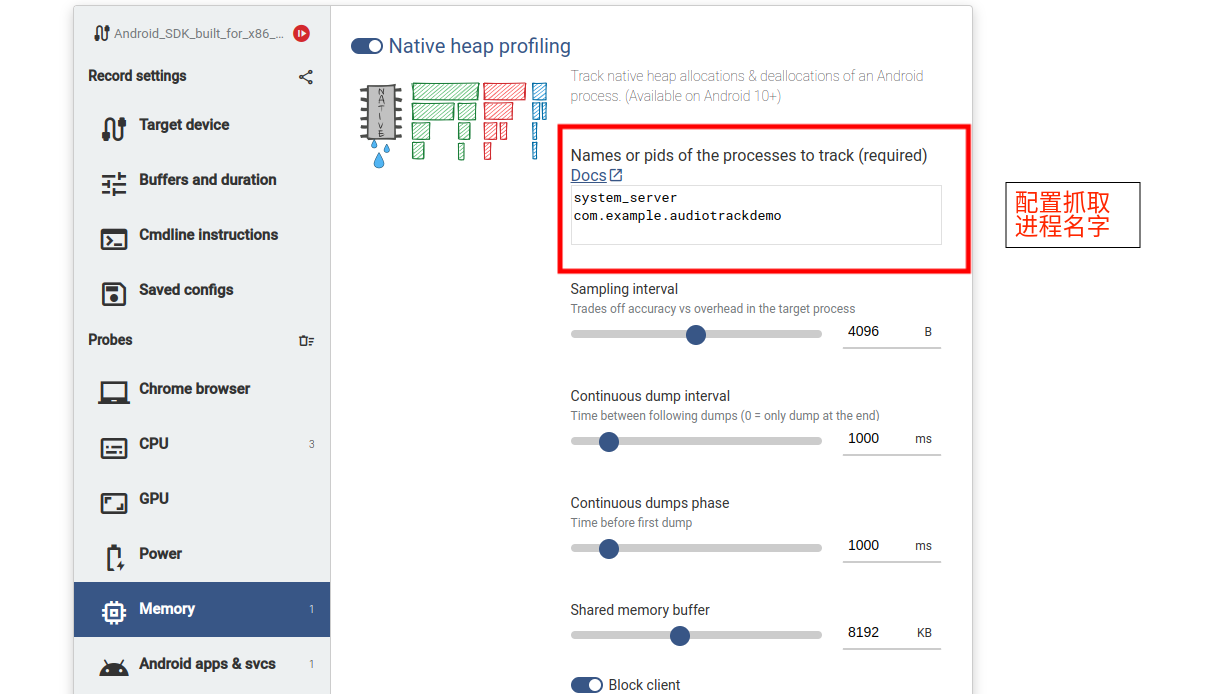
同时建议大家需要针对固定的包名进程名字进行抓取配置:
这块配置后在cmdline中可以看到抓取的config对应的配置文件:
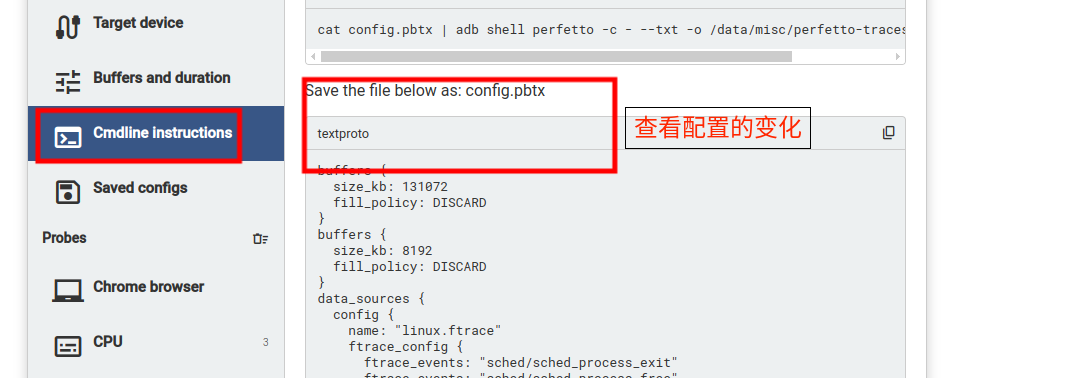 这块其实就是加入了一个data_source为"android.heapprofd"。
data_sources {
  config {
    name: "android.heapprofd"
    heapprofd_config {
      sampling_interval_bytes: 4096
      process_cmdline: "system_server"
      process_cmdline: "com.example.audiotrackdemo"
      continuous_dump_config {
        dump_phase_ms: 1000
        dump_interval_ms: 1000
      }
      shmem_size_bytes: 8388608
      block_client: true
      all_heaps: false
    }
  }
配置完成后直接点击按钮进行抓取
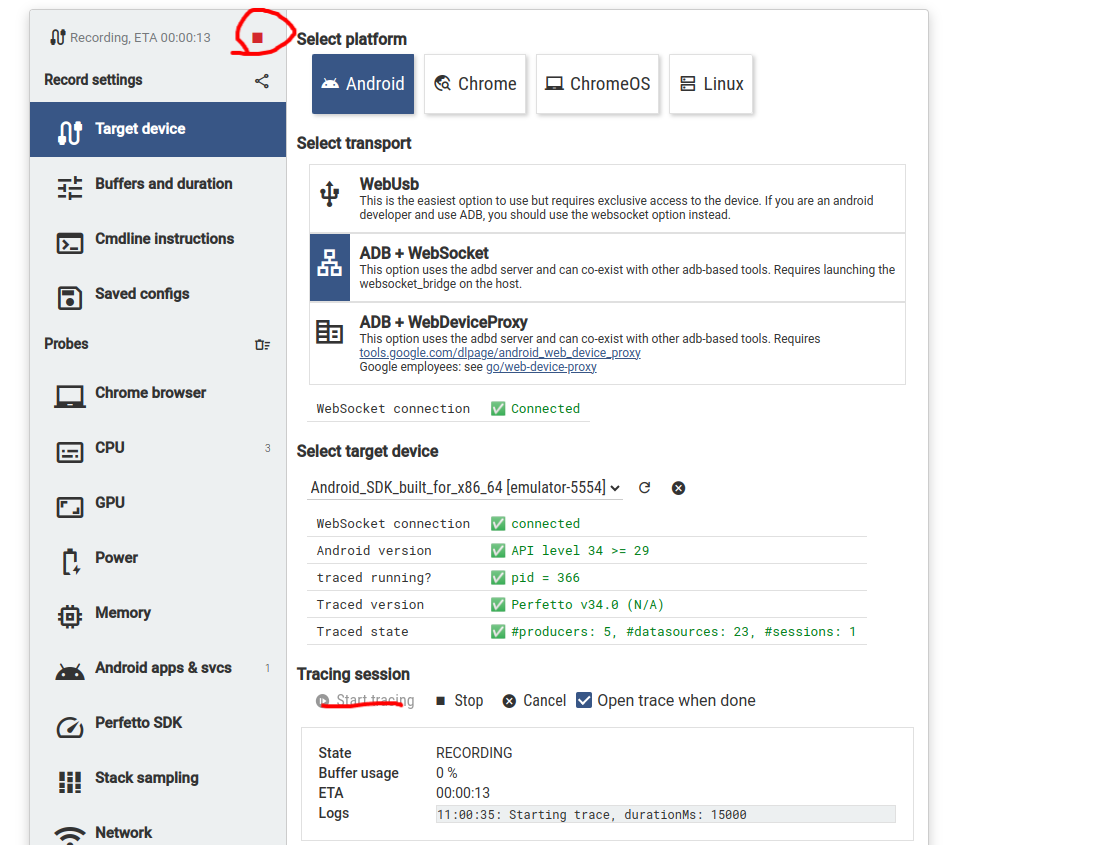 上面也会显示对应的进度情况出来。
抓取方式2:
当然大家也可以直接使用Perfetto命令进行抓取,
使用命令
cat config.pbtx | adb shell perfetto -c - --txt -o /data/misc/perfetto-traces/trace.pftrace
这里的 config.pbtx 文件如下:
buffers {
  size_kb: 131072
  fill_policy: DISCARD
}
buffers {
  size_kb: 8192
  fill_policy: DISCARD
}
data_sources {
  config {
    name: "linux.ftrace"
    ftrace_config {
      ftrace_events: "sched/sched_process_exit"
      ftrace_events: "sched/sched_process_free"
      ftrace_events: "task/task_newtask"
      ftrace_events: "task/task_rename"
      ftrace_events: "sched/sched_switch"
      ftrace_events: "power/suspend_resume"
      ftrace_events: "sched/sched_blocked_reason"
      ftrace_events: "sched/sched_wakeup"
      ftrace_events: "sched/sched_wakeup_new"
      ftrace_events: "sched/sched_waking"
      ftrace_events: "sched/sched_process_exit"
      ftrace_events: "sched/sched_process_free"
      ftrace_events: "task/task_newtask"
      ftrace_events: "task/task_rename"
      ftrace_events: "power/cpu_frequency"
      ftrace_events: "power/cpu_idle"
      ftrace_events: "power/suspend_resume"
      ftrace_events: "ftrace/print"
      atrace_categories: "adb"
      atrace_categories: "aidl"
      atrace_categories: "am"
      atrace_categories: "audio"
      atrace_categories: "binder_driver"
      atrace_categories: "binder_lock"
      atrace_categories: "bionic"
      atrace_categories: "database"
      atrace_categories: "gfx"
      atrace_categories: "hal"
      atrace_categories: "input"
      atrace_categories: "pm"
      atrace_categories: "power"
      atrace_categories: "res"
      atrace_categories: "ss"
      atrace_categories: "view"
      atrace_categories: "wm"
      disable_generic_events: true
    }
  }
}
data_sources {
  config {
    name: "linux.process_stats"
    target_buffer: 1
    process_stats_config {
    }
  }
}
data_sources {
  config {
    name: "linux.sys_stats"
    sys_stats_config {
      stat_period_ms: 500
      stat_counters: STAT_CPU_TIMES
      stat_counters: STAT_FORK_COUNT
      cpufreq_period_ms: 500
    }
  }
}
data_sources {
  config {
    name: "android.heapprofd"
    heapprofd_config {
      sampling_interval_bytes: 4096
      process_cmdline: "system_server"
      process_cmdline: "com.example.audiotrackdemo"
      continuous_dump_config {
        dump_phase_ms: 1000
        dump_interval_ms: 1000
      }
      shmem_size_bytes: 8388608
      block_client: true
      all_heaps: false
    }
  }
}
duration_ms: 15000
抓取文件后导入查看。
抓取到文件后查看native内存方式
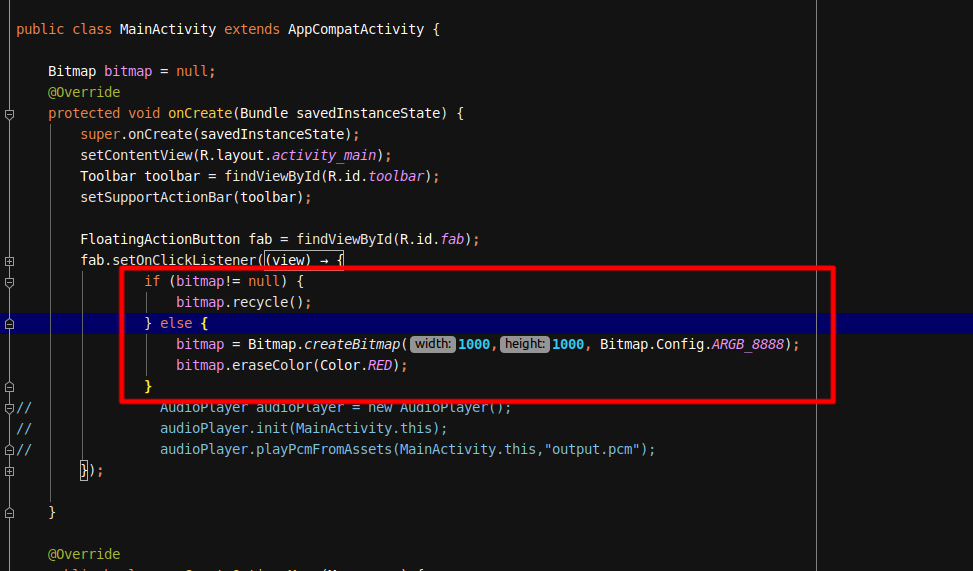
这里使用一个demo来测试,使用在onCreate中进行Bitmap的构造,看看是否可以看到它的一个内存情况
相关的代码:
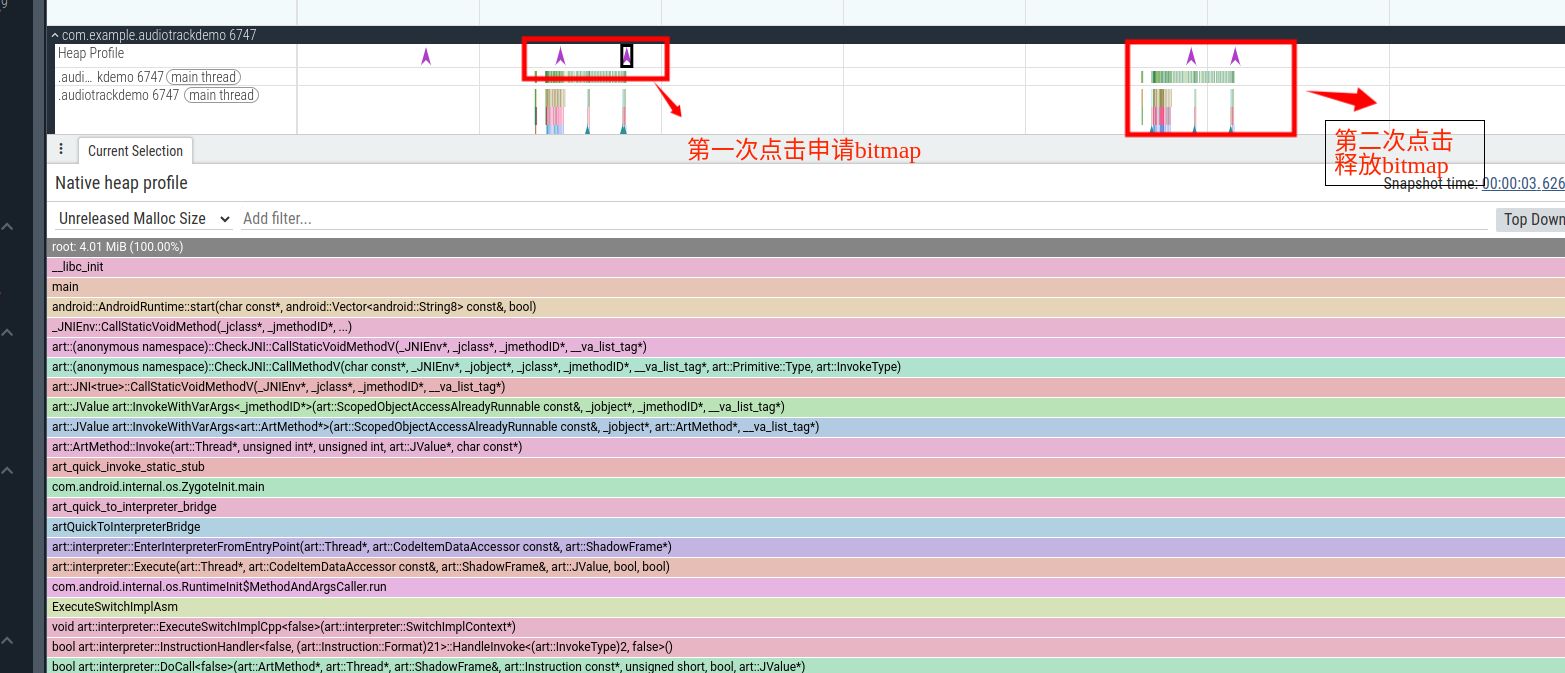
针对MainActivity中点击按钮后,第一次点击进行bitmap的申请,第二次进行bitmap的释放。
Perfetto查看情况:
在哪看native的内存堆栈情况呢?
这里就需要看你前面config设置的是哪个进程名字,然后去对应进程中找下面的Heap Profile
 这一个Heap Prefile轨道上进行箭头点击,每一个箭头代表一次native内存采样,点击箭头后可以看到明显有这个时间点的内存情况,点击箭头后展示如下:
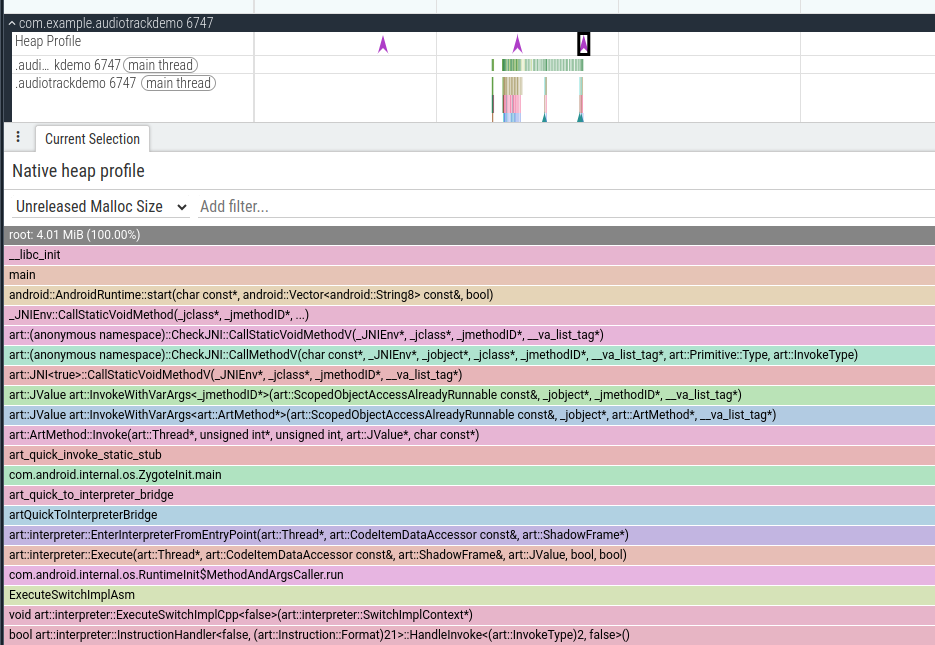
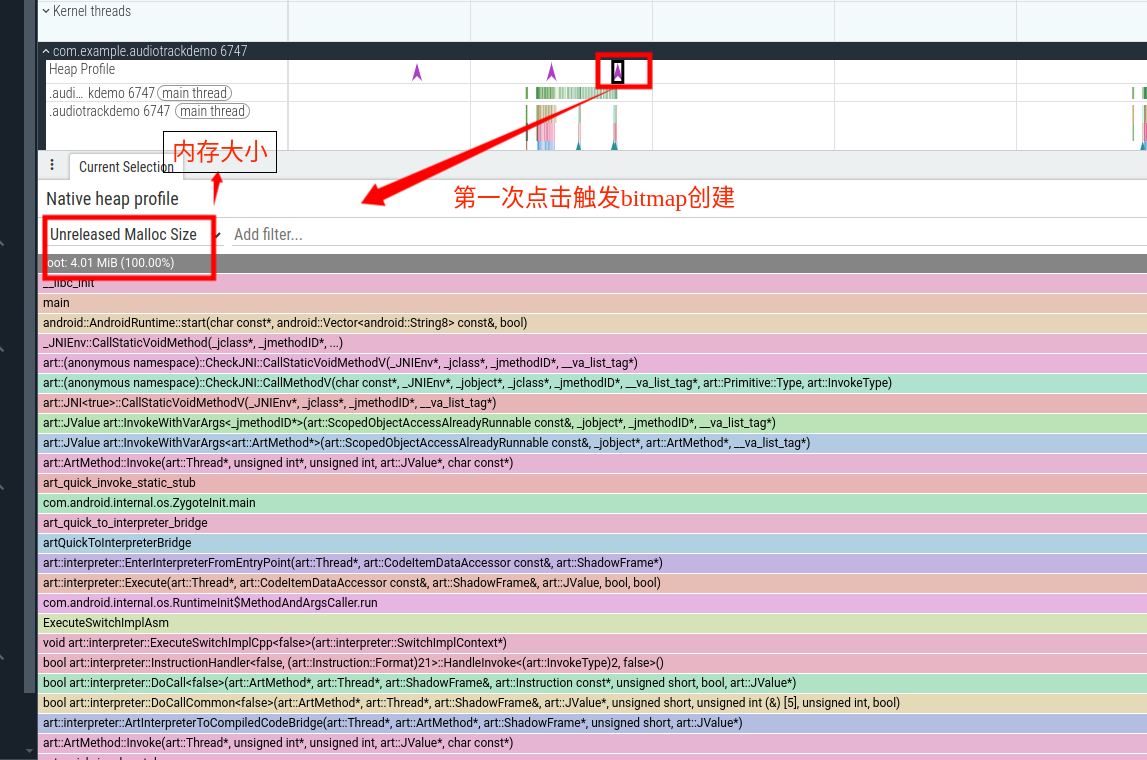
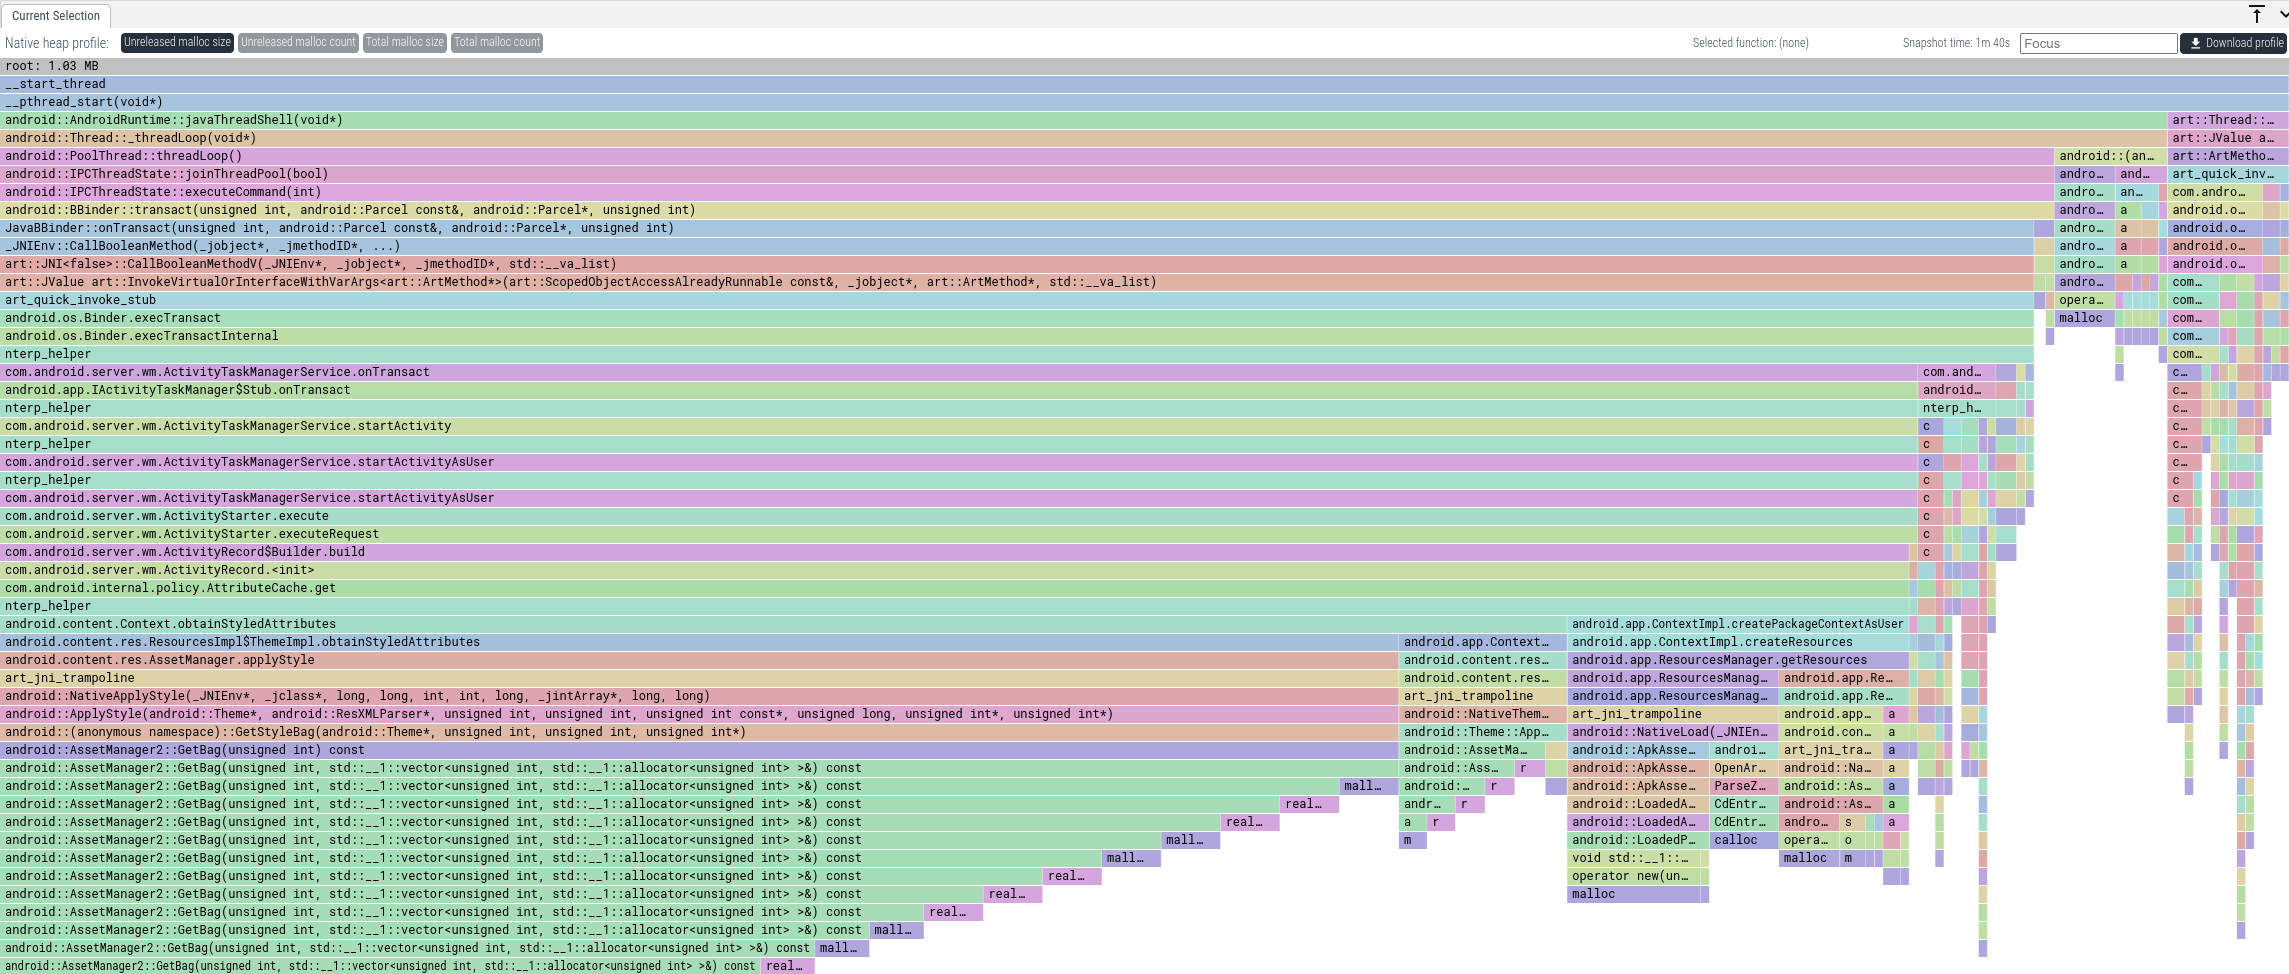
上面主要看下面的Unrelease Malloc部分代表没有释放的内存,而且还会携带这个内存的申请堆栈:
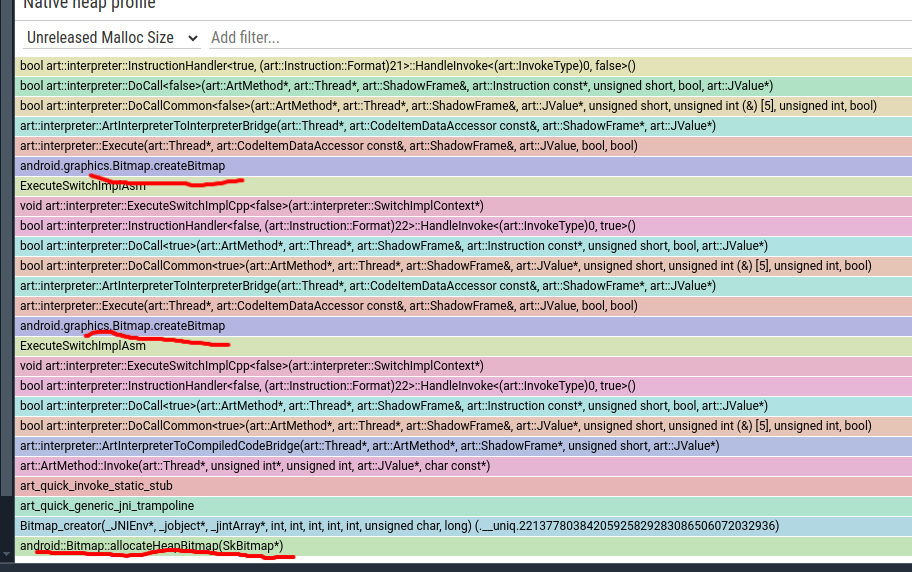 上面是这个bitmap申请的的调用堆栈,从而方便我们详细定位。
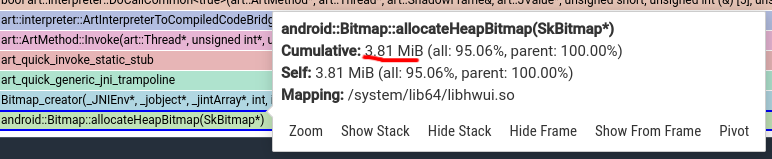 也可以点击最后的alloc部分通过大小大概确定是否为自己的申请的。
上面bitmap是1000x1000为4个字节一个像素点。
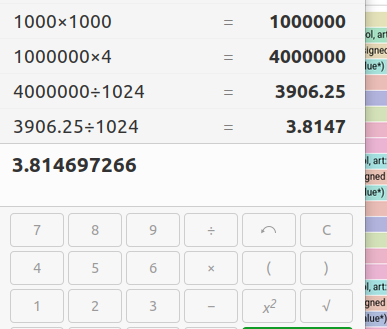
完全匹配。
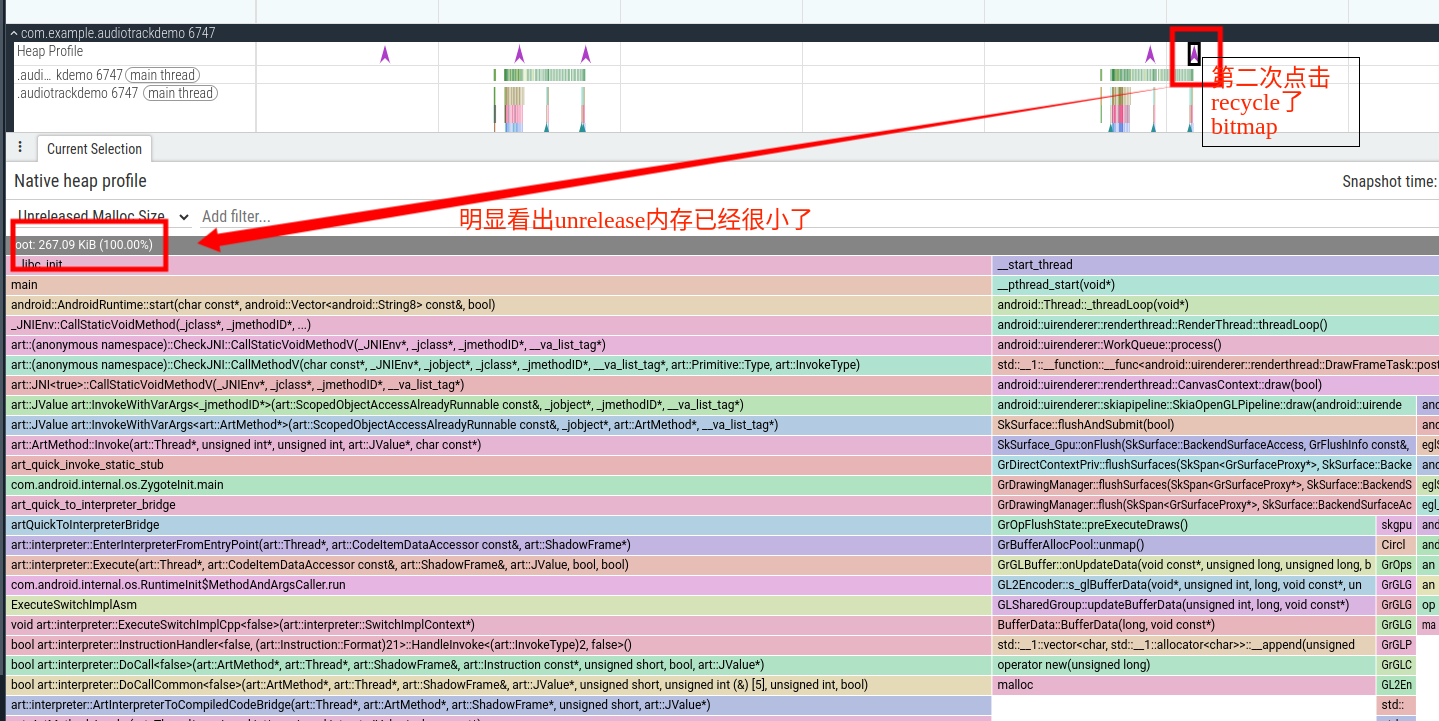
下面再看看第二次点击释放bitmap后,unrelease中是否还存在这个bitmap:
 那么看看详细的情况:
原文地址:
https://mp.weixin.qq.com/s/ydnQaEL1RBY9cWuir0DooA
参考文档:
https://perfetto.dev/docs/data-sources/native-heap-profiler#java-heap-sampling


 4721
4721

 被折叠的 条评论
为什么被折叠?
被折叠的 条评论
为什么被折叠?
 到【灌水乐园】发言


