面向对象主要步骤
- 导入模块
- 创建画布
- 在画布上添加绘图区域
- 准备数据
- 调用绘图方法绘制图表
- 展示图表
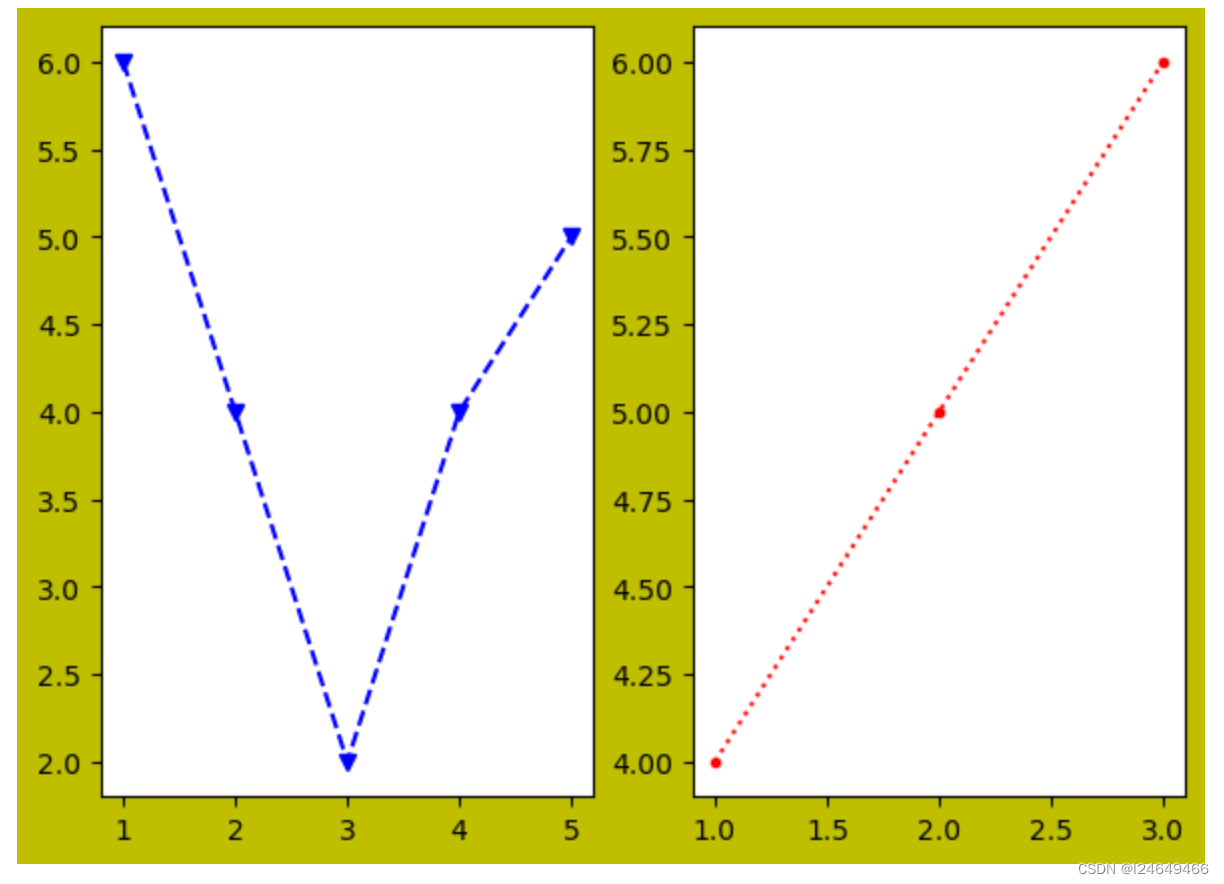
一、折线图
#1.导入模块
import matplotlib.pyplot as plt
import numpy as np

#2.创建画布
fig = plt.figure(figsize=(7, 5), facecolor='y')     #figsize:画布大小(宽,高)

#3.在画布上添加绘图区域
ax1 = fig.add_subplot(121)
ax2 = fig.add_subplot(122)

#4.准备数据
x = np.array([1, 2, 3, 4, 5])
y = np.array([6, 4, 2, 4, 5])
x1 = np.array([1, 2, 3])
y1 = np.array([4, 5, 6])

#5.调用绘图方法绘制图表
ax1.plot(x, y, 'b--v')         #b:blue(颜色)  '--':虚线(线型)  'v': triangle_down marker(点型)
ax2.plot(x1, y1, 'r:.')        #r:red(颜色)   ':':点线(线型)   '.': point marker(点型)

# 6.展示图表
plt.show()
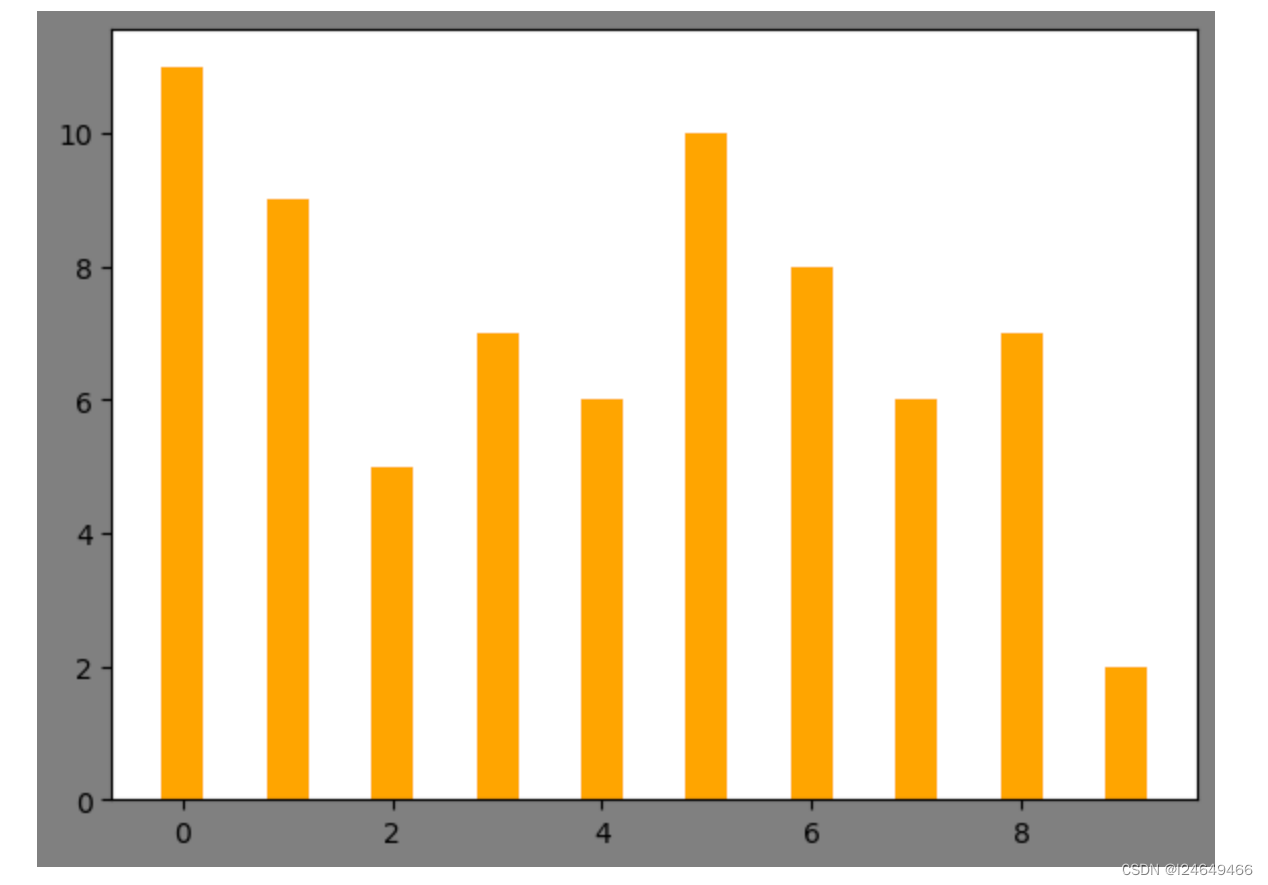
二、柱形图
#1.导入模块
import matplotlib.pyplot as plt
import numpy as np

#2.创建画布
fig = plt.figure(figsize=(7, 5), facecolor='grey')          #figsize:画布大小(宽,高)

#3. 在画布上添加绘图区域
ax = fig.add_subplot(111)

#4. 数据准备
x = np.arange(0,10)
y = np.array([11,9,5,7,6,10,8,6,7,2])
bar_width = 0.4               #柱形宽度
#5.调用绘图方法绘制图表
ax.bar(x,y,width=bar_width,color='orange')

#6.展示图表
plt.show()


 被折叠的 条评论
为什么被折叠?
被折叠的 条评论
为什么被折叠?
 到【灌水乐园】发言


