


使用pands 和 matplotlib
import pandas as pd
import matplotlib.pyplot as plt
df = pd.read_excel("E:\\Desktop\\test_draw.xlsx")
print(df)
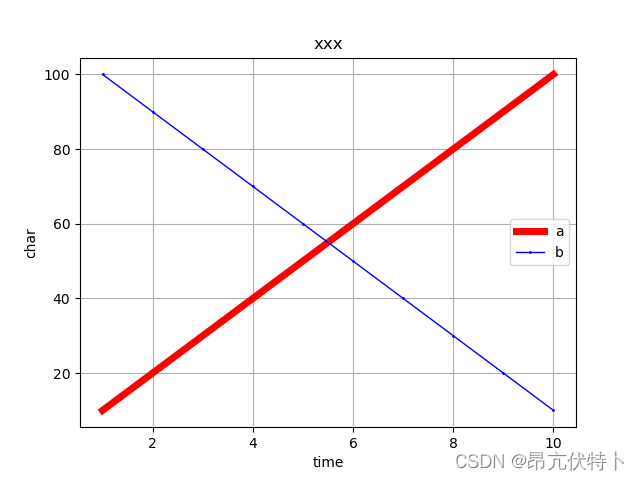
plt.plot(df["time"],df["aa"],label='a',linewidth=5,color='r',marker='*', markerfacecolor='blue',markersize=1)
plt.plot(df["time"],df["bb"],label='b',linewidth=1,color='b',marker='o', markerfacecolor='blue',markersize=1)
plt.xlabel("time")
plt.ylabel('char')
plt.title("xxx")
plt.legend()
plt.grid()
plt.show()


 847
847

 被折叠的 条评论
为什么被折叠?
被折叠的 条评论
为什么被折叠?
 到【灌水乐园】发言


