


作者:Bruno Rodrigues
原文链接:https://www.brodrigues.co/blog/2018-10-05-ggplot2_purrr_officer/
来源:R语言

最近我面临以下的问题:创建数以百计的图片以便我们的客户仍旧可以编辑。这意味着我需要把图表导出到Excel、PPT或者其它客户熟悉的工具,而不是像往常那样把图片直接以pdf或者png形式导出。尽管我还是希望使用R解决这个问题,因为我可以进行一直以来的操作,当我需要完成重复性任务时,比如生成上百张图,就像一系列国家的地图,并且每个国家单独制作一张。这是我在前一篇博客里面讨论的内容, Make ggplot2 purrr
因此,经过上网搜寻,我发现了{officer}包,这个包允许你把对象放在Microsoft文件中。比如,可编辑图放在ppt文件中。这就是我将要在这篇博客中展示的。
先从装载需要的包开始:
1library("tidyverse")
2library("officer")
3library("rvg")
然后,我将使用“时间使用”调查的数据,这数据我在前一篇博客中Going from a human readable Excel file to a machine-readable csv with {tidyxl}(翻译)有讨论。
你可以在这里下载数据。
让我们导入并且预处理数据吧!
1time_use <- rio::import("clean_data.csv")
2
3
4time_use <- time_use %>%
5    filter(population %in% c("Male", "Female")) %>%
6    filter(activities %in% c("Personal care", "Sleep", "Eating",
7                             "Employment", "Household and family care")) %>%
8    group_by(day) %>%
9    nest()
我只保留了两类:“Male”和“Female”,以及5项活动。接着按照day分组并把其余的nested在data中。以下就是呈现的状况:
1time_use
1## # A tibble: 3 x 2
2##   day                         data
3##   <chr>                       <list>
4## 1 Year 2014_Monday til Friday <tibble [10 × 4]>
5## 2 Year 2014_Saturday          <tibble [10 × 4]>
6## 3 Year 2014_Sunday            <tibble [10 × 4]>
正如展现的那样,'time_use'是一个有两列的tibble,第一列'day'包含了days,第二列'data'是一个类型列,并且列中的每个元素是自身的tibbles。让我们看看其中一个的内容:
1time_use$data[1]
 1## [[1]]
 2## # A tibble: 10 x 4
 3##    population activities                time  time_in_minutes
 4##    <chr>      <chr>                     <chr>           <int>
 5##  1 Male       Personal care             11:00             660
 6##  2 Male       Sleep                     08:24             504
 7##  3 Male       Eating                    01:46             106
 8##  4 Male       Employment                08:11             491
 9##  5 Male       Household and family care 01:59             119
10##  6 Female     Personal care             11:15             675
11##  7 Female     Sleep                     08:27             507
12##  8 Female     Eating                    01:48             108
13##  9 Female     Employment                06:54             414
14## 10 Female     Household and family care 03:49             229
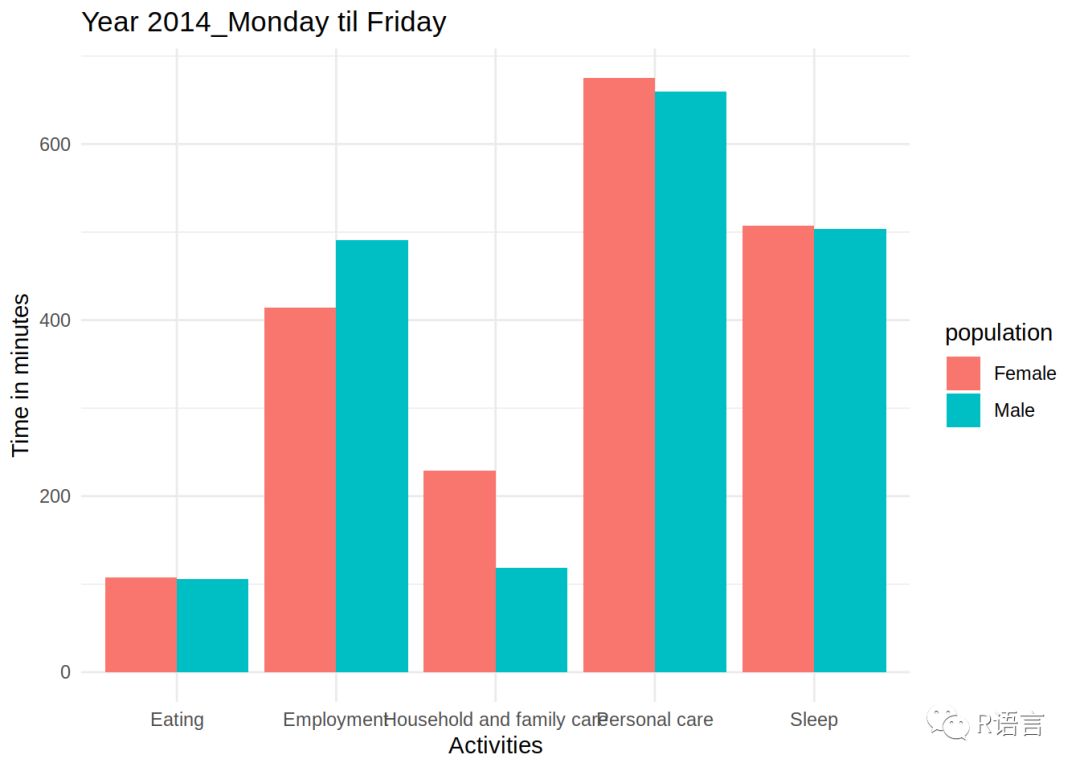
现在可以使用以下的代码为每一天绘制图了:
1my_plots <- time_use %>%
2    mutate(plots = map2(.y = day, .x = data, ~ggplot(data = .x) + theme_minimal() +
3                       geom_col(aes(y = time_in_minutes, x = activities, fill = population),
4                                position = "dodge") +
5                       ggtitle(.y) +
6                       ylab("Time in minutes") +
7                       xlab("Activities")))
这些步骤在之前的博客中 Make ggplot2 purrr都很详细。查看my_plots:
1my_plots
1## # A tibble: 3 x 3
2##   day                         data              plots
3##   <chr>                       <list>            <list>
4## 1 Year 2014_Monday til Friday <tibble [10 × 4]> <S3: gg>
5## 2 Year 2014_Saturday          <tibble [10 × 4]> <S3: gg>
6## 3 Year 2014_Sunday            <tibble [10 × 4]> <S3: gg>
最后一列plots是一个列,其中每个元素都是一张图!我们可以看看其中一个:
1my_plots$plots[1]
1## [[1]]
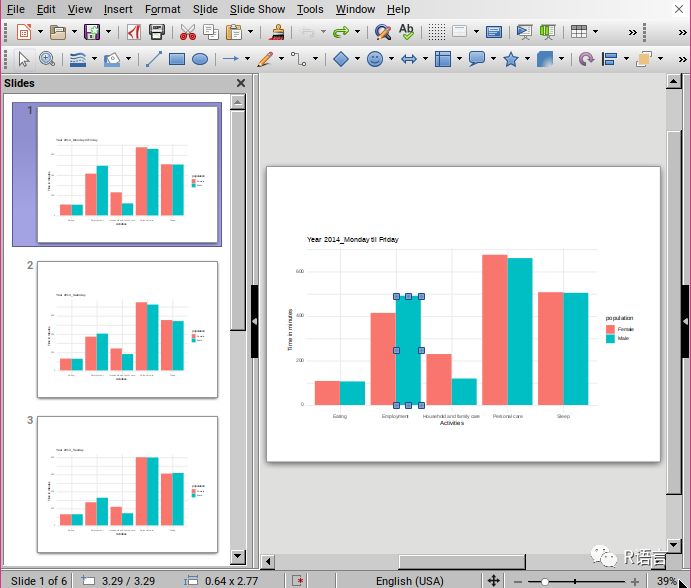
这就是我可以导出为pdf或者png形式的图象。但这不是我想要的,我需要把这些图象导出为ppt可操作的图表。对于每一个图像,我会采用以下操作(包含每个
{officer}
的文件):
1read_pptx() %>%
2    add_slide(layout = "Title and Content", master = "Office Theme") %>%
3    ph_with_vg(code = print(one_plot), type = "body") %>%
4    print(target = path)
我写了一个包装把一系列的参数结合起来:
 1create_pptx <- function(plot, path){
 2    if(!file.exists(path)) {
 3        out <- read_pptx()
 4    } else {
 5        out <- read_pptx(path)
 6    }
 7
 8    out %>%
 9        add_slide(layout = "Title and Content", master = "Office Theme") %>%
10        ph_with_vg(code = print(plot), type = "body") %>%
11        print(target = path)
12}
该函数有两个参数:plot以及path。plot必须是一个plot对象,就像my_plots里面的plots列包含的plot对象那样。path是我想要保存pptx的路径。
第一行检查文件是否存在,如果是,slides就会添加到存在的文件中,如果不是,一个新的pptx被创建。其余的代码跟文件里面的非常相似。现在,为了创建我的pptx,我只需要把plots列匹配好并且提供一个path:
1map(my_plots$plots, create_pptx, path = "test.pptx")
1## [[1]]
2## [1] "/home/cbrunos/Documents/b-rodrigues.github.com/content/blog/test.pptx"
3##
4## [[2]]
5## [1] "/home/cbrunos/Documents/b-rodrigues.github.com/content/blog/test.pptx"
6##
7## [[3]]
8## [1] "/home/cbrunos/Documents/b-rodrigues.github.com/content/blog/test.pptx"
这是最后的结果:

往期精彩:

公众号后台回复关键字即可学习
回复 爬虫 爬虫三大案例实战
回复 Python 1小时破冰入门
回复 数据挖掘 R语言入门及数据挖掘
回复 人工智能 三个月入门人工智能
回复 数据分析师 数据分析师成长之路
回复 机器学习 机器学习的商业应用
回复 数据科学 数据科学实战
回复 常用算法 常用数据挖掘算法


 136
136

 被折叠的 条评论
为什么被折叠?
被折叠的 条评论
为什么被折叠?
 到【灌水乐园】发言


