


taoyan:R语言中文社区特约作家,伪码农,R语言爱好者,爱开源。
个人博客: https://ytlogos.github.io/
公众号:生信大讲堂
往期回顾
ggplot2学习笔记系列之利用ggplot2绘制误差棒及显著性标记


简介
我们知道发表文章的时候不同杂志的配色方案是不同的,如果参加工作的话,不同公司的配色方案也是不一样的,每个人的色觉也是不一样的,所以如果可以创建属于自己的配色方案的话以后可视化就可以随心所欲了。
方案
接下来我将基于下面的几种颜色创建属于我自己的调色板

主要有以下几个方面:
将颜色与其对应的十六进制矢量联系起来
创建访问十六进制矢量的函数
调色板命名
访问调用调色板
创建兼容ggplot2的尺度函数
首先我们创建一个颜色变量
library(ggplot2)
theme_set(theme_minimal())
my_colors <- c(
`purple` = "#7b0099",
`yellow` = "#ff9900",
`black` = "#221f1f",
`white` = "#f5f5f1",
`red` = "#e50914"
)
后续如果需要对颜色进行修改或添加都可以在这个颜色变量中进行。
下面创建一个可以从该变量中提取颜色对应的十六进制的函数
#' Function to extract my_colors as hex codes
#'
#' @param ... Character names of my_colors
#'
my_cols <- function(...){
cols <- c(...)
if (is.null(cols))
return(my_colors)
my_colors[cols]
}
此时我们可以十分方便获取颜色的十六进制,下面演示一下:
my_cols()
## purple yellow black white red
## "#7b0099" "#ff9900" "#221f1f" "#f5f5f1" "#e50914"
my_cols("purple")
## purple
## "#7b0099"
my_cols("purple","yellow")
## purple yellow
## "#7b0099" "#ff9900"
my_cols("yellow","purple")
## yellow purple
## "#ff9900" "#7b0099"
此时我们可以在ggplot2中调用这些颜色
#使用gapminder包中的数据集gapminder来演示
library(gapminder)
head(gapminder)
## # A tibble: 6 x 6
## country continent year lifeExp pop gdpPercap
## <fct> <fct> <int> <dbl> <int> <dbl>
## 1 Afghanistan Asia 1952 28.8 8425333 779
## 2 Afghanistan Asia 1957 30.3 9240934 821
## 3 Afghanistan Asia 1962 32.0 10267083 853
## 4 Afghanistan Asia 1967 34.0 11537966 836
## 5 Afghanistan Asia 1972 36.1 13079460 740
## 6 Afghanistan Asia 1977 38.4 14880372 786
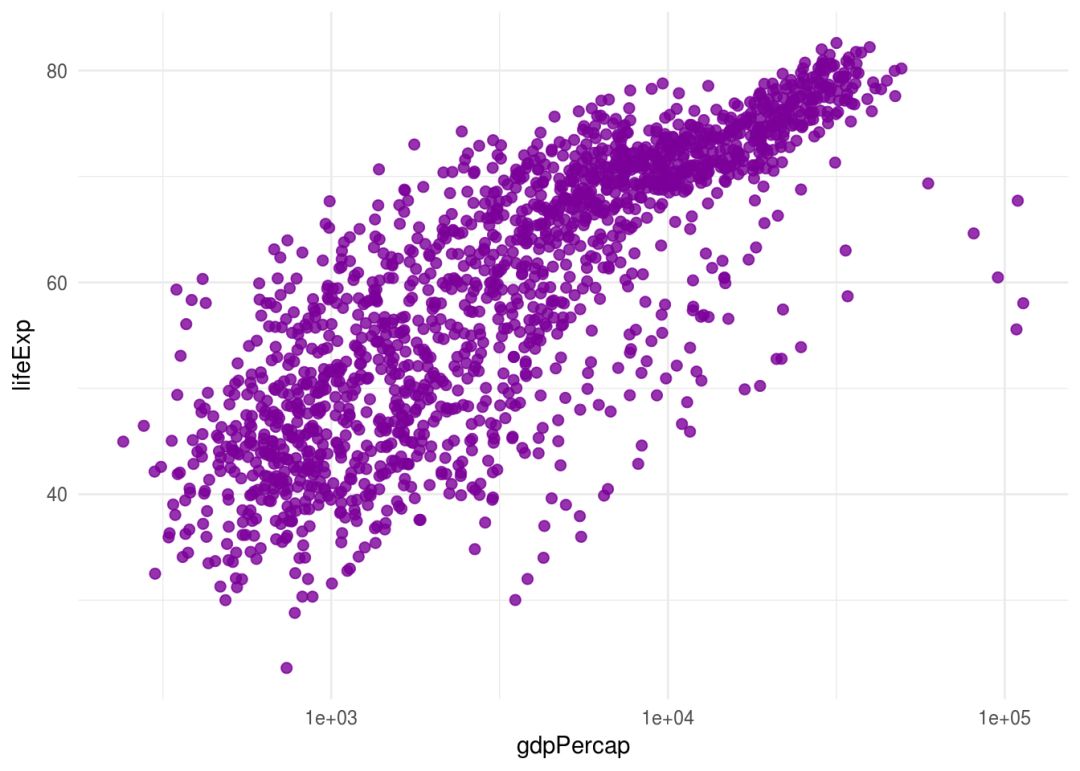
ggplot(gapminder, aes(gdpPercap, lifeExp))+
geom_point(color=my_cols("purple"), size=2, alpha=0.8)+
scale_x_log10()
 创建调色板
创建调色板
调色板就是一个颜色列表方便我们后面使用,将各种颜色组合搭配
my_palettes <- list(
`main` = my_cols("purple","yellow","red"),
`cool` = my_cols("purple","yellow"),
`hot` = my_cols("yellow","black","red"),
`mixed` = my_cols("purple","yellow","white","red"),
`bw` = my_cols("black","white")
)
在这个颜色列表中实际上我们创建了好几种颜色组合,下面创建一个函数来访问并调用它们
#' Return function to interpolate a my_palettes
#'
#' @param palette Character name of palette in my_palettes
#' @param reverse Boolean indicating whether the palette should be reversed
#' @param ... Additional arguments to pass to colorRampPalette()
#'
my_pal <- function(palette="main", reverse=FALSE, ...){
pal <- my_palettes[[palette]]
if (reverse) pal <- rev(pal)
colorRampPalette(pal, ...)
}
该函数通过不同颜色组合名称从列表中获取一个颜色组合(默认条件下是main),同时可以设置是否颠倒颜色顺序,之后传递给函数colorRampPaette()创建调色板。因此其返回的是一个函数。
my_pal("cool")
## function (n)
## {
## x <- ramp(seq.int(0, 1, length.out = n))
## if (ncol(x) == 4L)
## rgb(x[, 1L], x[, 2L], x[, 3L], x[, 4L], maxColorValue = 255)
## else rgb(x[, 1L], x[, 2L], x[, 3L], maxColorValue = 255)
## }
## <bytecode: 0x55ade91b4b70>
## <environment: 0x55ade91b3e20>
通过这个函数可以基于调色板返回不同数目的颜色,进而可以在原始颜色之间创建多级颜色梯度
my_pal("cool")(10)
## [1] "#7B0099" "#891188" "#982277" "#A73266" "#B54455" "#C45544" "#D36533"
## [8] "#E17622" "#F08810" "#FF9900"
pie(rep(1,10), col = my_pal("cool")(10))
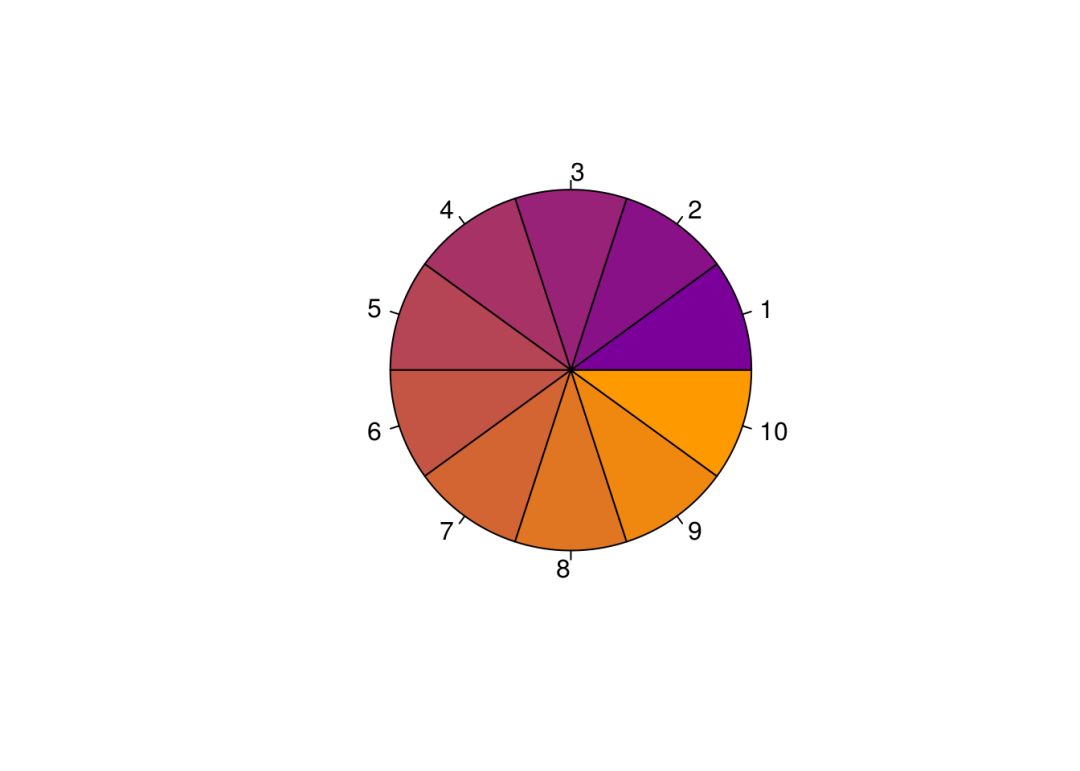 上图展示的10种颜色就是my_pal("cool")(10)返回的十六进制对应的颜色,这就为ggplot2中的尺度颜色函数创造了可能
Scales for ggplot2
ggplot2中颜色映射有color和fill即颜色和填充。
#' Color scale constructor for my_colors
#'
#' @param palette Character name of palette in my_palettes
#' @param discrete Boolean indicating whether color aesthetic is discrete or not
#' @param reverse Boolean indicating whether the palette should be reversed
#' @param ... Additional arguments passed to discrete_scale() or scale_color_gradientn(), used #' #' respectively when discrete is TRUE or FALSE
#'
scale_color_my <- function(palette="main", discrete=TRUE, reverse=FALSE, ...){
pal <- my_pal(palette = palette, reverse = reverse)
if (discrete){
discrete_scale("colour", paste0("my_", palette), palette = pal, ...)
}else{
scale_color_gradientn(colours = pal(256), ...)
}
}
#' Fill scale constructor for my_colors
#'
#' @param palette Character name of palette in my_palettes
#' @param discrete Boolean indicating whether color aesthetic is discrete or not
#' @param reverse Boolean indicating whether the palette should be reversed
#' @param ... Additional arguments passed to discrete_scale() or scale_color_gradientn(), used #' #' respectively when discrete is TRUE or FALSE
#'
scale_fill_my <- function(palette="main", discrete=TRUE, reverse=FALSE, ...){
pal <- my_pal(palette = palette, reverse = reverse)
if (discrete){
discrete_scale("fill",paste0("my_", palette), palette = pal, ...)
}else{
scale_fill_gradientn(colours = pal(256), ...)
}
}
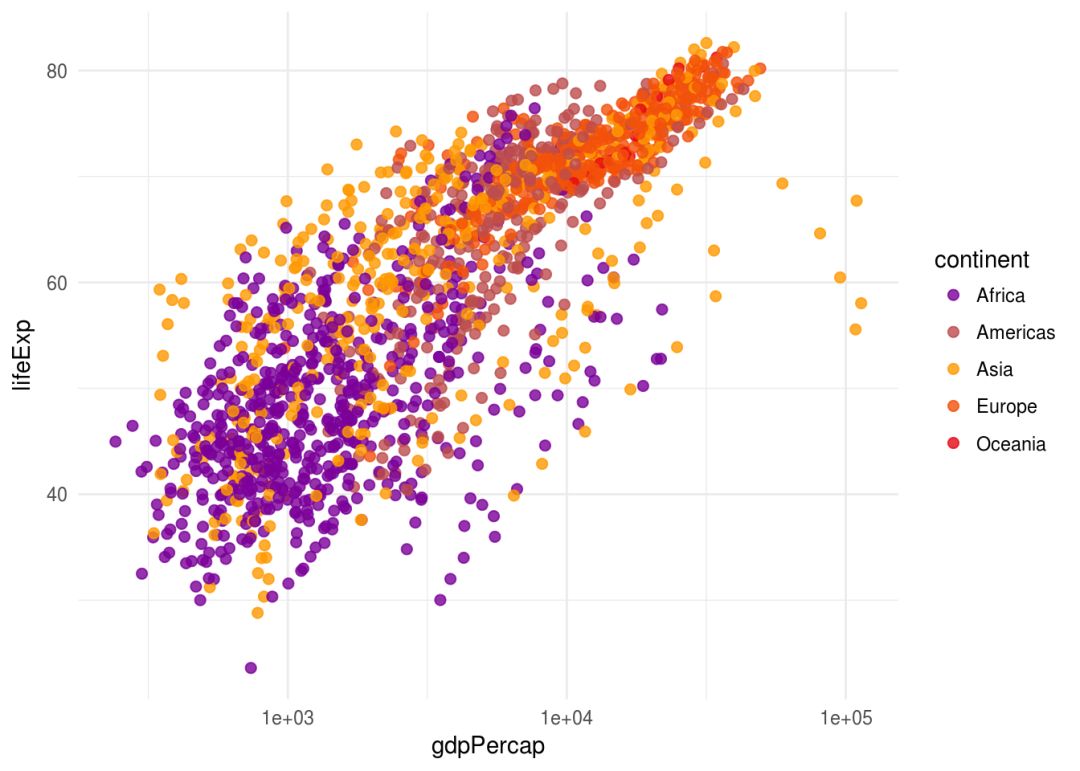
上面每个函数都制定一个调色板(默认是main),调色板是基于离散变量或连续变量,以及是否颠倒颜色顺序,同时还传递给了相关的ggplot2函数。下面可以试试它们在绘图过程中的表现
ggplot(gapminder,aes(gdpPercap, lifeExp, color=continent))+
geom_point(size=2, alpha=0.8)+
scale_x_log10()+
scale_color_my()
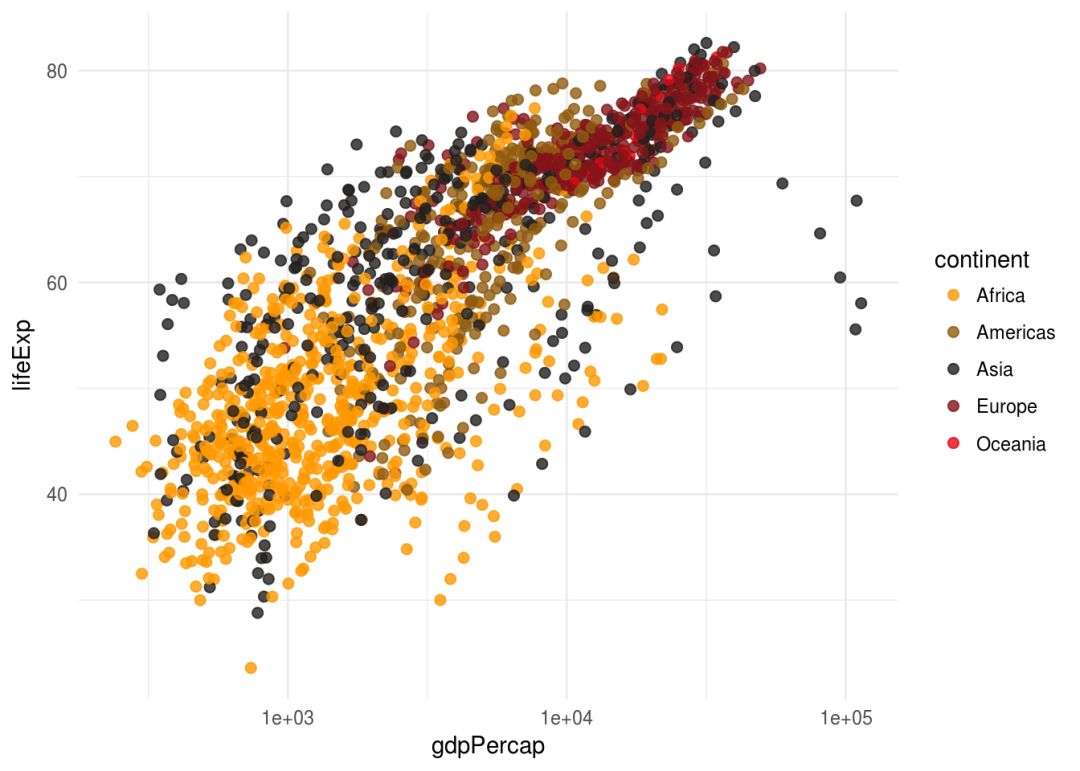
我们可以更换调色板试试
ggplot(gapminder,aes(gdpPercap, lifeExp, color=continent))+
geom_point(size=2, alpha=0.8)+
scale_x_log10()+
scale_color_my(palette = "hot")
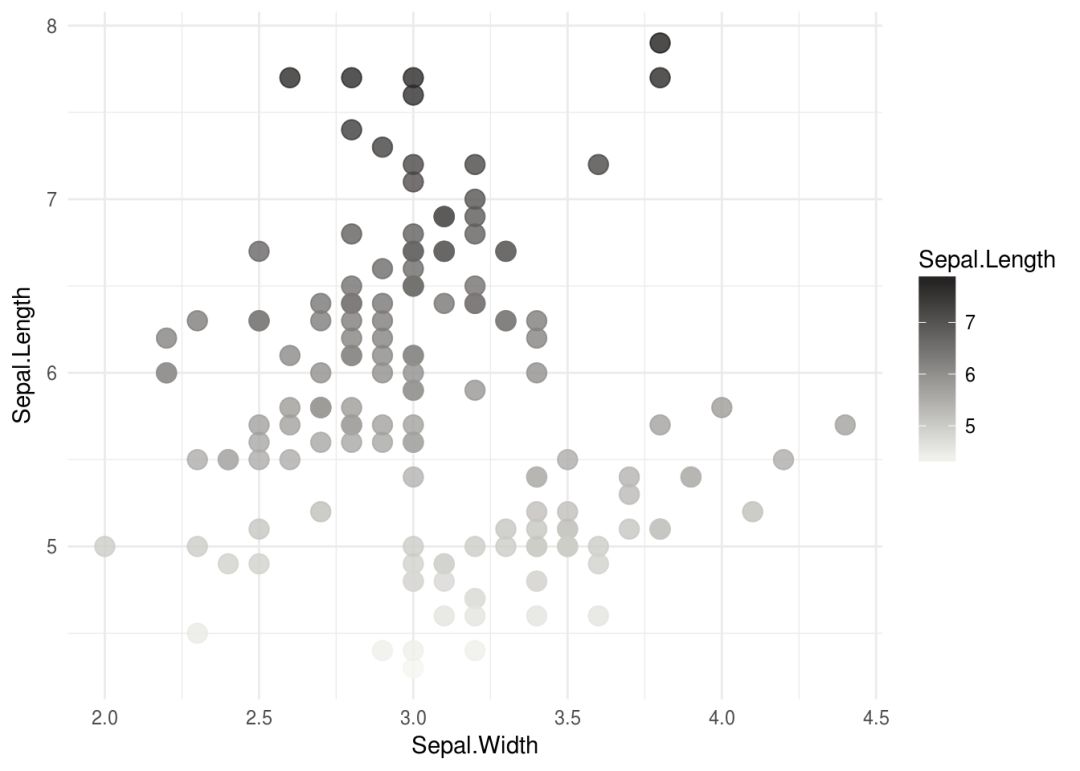
如果是连续变量的话
ggplot(iris, aes(Sepal.Width, Sepal.Length, color = Sepal.Length)) +
geom_point(size = 4, alpha = .8) +
scale_color_my(discrete = FALSE, palette = "bw", reverse = TRUE)
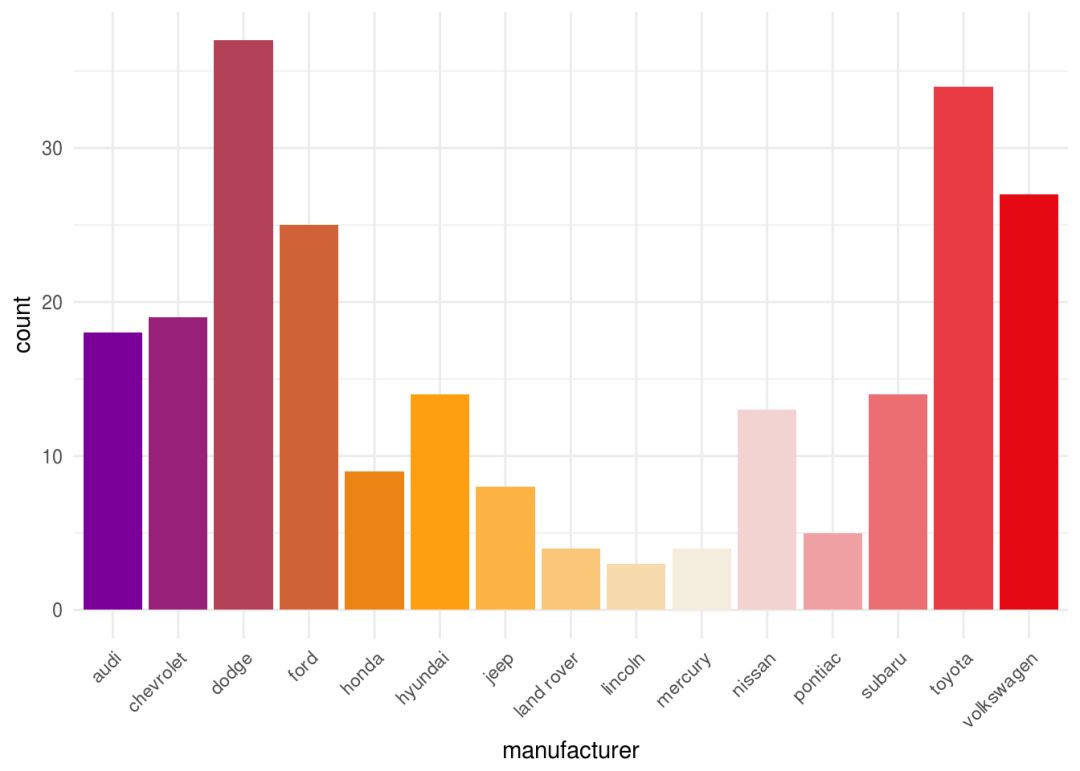
上面是颜色,下面试试填充
ggplot(mpg, aes(manufacturer, fill = manufacturer)) +
geom_bar() +
theme(axis.text.x = element_text(angle = 45, hjust = 1)) +
scale_fill_my(palette = "mixed", guide = "none")
包的创建
通过上面的内容可以看出,如果我们会创建包的话,将上述代码封装在一起再加上一些元素就形成了一个包,可以方便自己或他人后续使用。如果要创建包的话,可以学习Hadley Wickham的书R packages。
sessionInfo()
## R version 3.4.3 (2017-11-30)
## Platform: x86_64-pc-linux-gnu (64-bit)
## Running under: Ubuntu 17.10
##
## Matrix products: default
## BLAS: /usr/lib/x86_64-linux-gnu/atlas/libblas.so.3.10.3
## LAPACK: /usr/lib/x86_64-linux-gnu/atlas/liblapack.so.3.10.3
##
## locale:
## [1] LC_CTYPE=zh_CN.UTF-8 LC_NUMERIC=C
## [3] LC_TIME=zh_CN.UTF-8 LC_COLLATE=zh_CN.UTF-8
## [5] LC_MONETARY=zh_CN.UTF-8 LC_MESSAGES=zh_CN.UTF-8
## [7] LC_PAPER=zh_CN.UTF-8 LC_NAME=C
## [9] LC_ADDRESS=C LC_TELEPHONE=C
## [11] LC_MEASUREMENT=zh_CN.UTF-8 LC_IDENTIFICATION=C
##
## attached base packages:
## [1] stats graphics grDevices utils datasets methods base
##
## other attached packages:
## [1] gapminder_0.3.0 ggplot2_2.2.1
##
## loaded via a namespace (and not attached):
## [1] Rcpp_0.12.15 knitr_1.20 magrittr_1.5 munsell_0.4.3
## [5] colorspace_1.3-2 rlang_0.2.0 stringr_1.3.0 plyr_1.8.4
## [9] tools_3.4.3 grid_3.4.3 gtable_0.2.0 utf8_1.1.3
## [13] cli_1.0.0 htmltools_0.3.6 assertthat_0.2.0 yaml_2.1.16
## [17] lazyeval_0.2.1 rprojroot_1.3-2 digest_0.6.15 tibble_1.4.2
## [21] crayon_1.3.4 evaluate_0.10.1 rmarkdown_1.8 labeling_0.3
## [25] stringi_1.1.6 compiler_3.4.3 pillar_1.1.0 scales_0.5.0
## [29] backports_1.1.2

公众号后台回复关键字即可学习
回复 R R语言快速入门及数据挖掘
回复 Kaggle案例 Kaggle十大案例精讲(连载中)
回复 文本挖掘 手把手教你做文本挖掘
回复 可视化 R语言可视化在商务场景中的应用
回复 大数据 大数据系列免费视频教程
回复 量化投资 张丹教你如何用R语言量化投资
回复 用户画像 京东大数据,揭秘用户画像
回复 数据挖掘 常用数据挖掘算法原理解释与应用
回复 机器学习 人工智能系列之机器学习与实践
回复 爬虫 R语言爬虫实战案例分享


 618
618

 被折叠的 条评论
为什么被折叠?
被折叠的 条评论
为什么被折叠?
 到【灌水乐园】发言


