


通常很难通过观察时间测量值来表征数据中的振荡行为。频谱分析有助于确定信号是否为周期性信号并测量不同周期。
办公楼内的温度计每半小时测量一次室内温度,持续四个月。加载数据并对其绘图。将温度转换为摄氏度。测量时间以周为单位。因此,采样率为 2 次测量/小时 × 24 小时/天 × 7 天/周 = 336 次测量/周。
load officetemp

tempC = (temp - 32)*5/9;

fs = 2*24*7;
t = (0:length(tempC) - 1)/fs;

plot(t,tempC)
xlabel('Time (weeks)')
ylabel('Temperature ( {}^\circC )')
axis tight
如图所示:
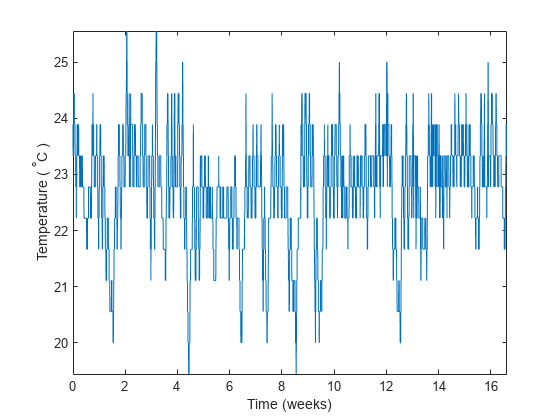
温度似乎确实有震荡特性,但周期的长度并不容易确定。此时,看看信号的频率成分。
减去均值以重点关注温度波动。计算并绘制周期图。
tempnorm = tempC - mean(tempC);

[pxx,f] = periodogram(tempnorm,[],[],fs);

plot(f,pxx)
ax = gca;
ax.XLim = [0 10];
xlabel('Frequency (cycles/week)')
ylabel('Magnitude')
如图所示:
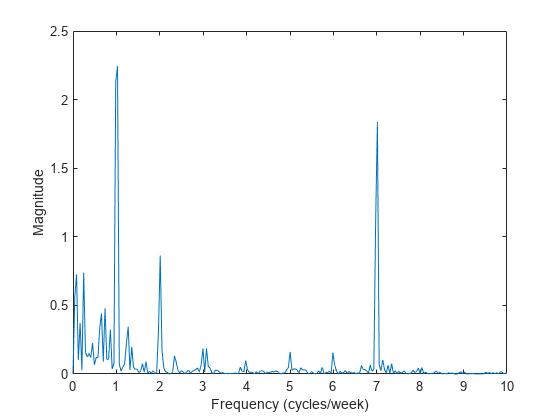
温度显然有日周期和周周期。结果并不令人惊讶:在人们工作时温度较高,晚上和周末温度较低。


 被折叠的 条评论
为什么被折叠?
被折叠的 条评论
为什么被折叠?
 到【灌水乐园】发言


