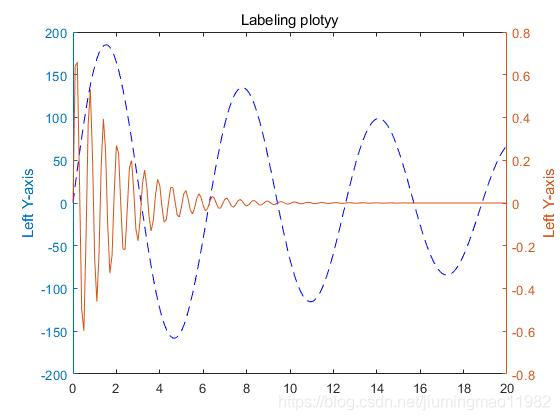
%%  plotyy()
x=0:0.1:20;
y1=200*exp(-0.05*x).*sin(x);
y2=0.8*exp(-0.5*x).*sin(10*x);
[AX,H1,H2]=plotyy(x,y1,x,y2);
set(get(AX(1),'Ylabel'),'String','Left Y-axis') % 标记
set(get(AX(2),'Ylabel'),'String','Left Y-axis') % 标记
title('Labeling plotyy');
set(H1,'Linestyle',':','Color','red')
set(H1,'Linestyle','--','Color','blue')
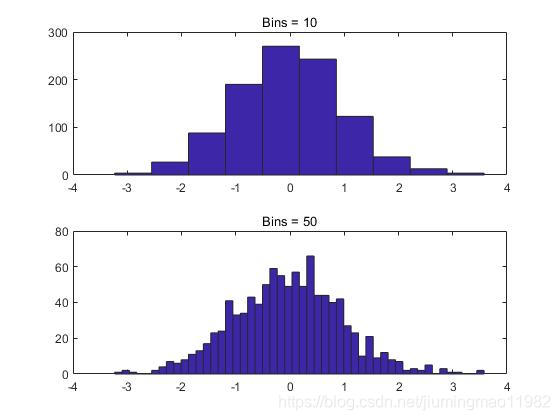
%% Histogram
clc
y=randn(1,1000);
subplot(2,1,1);
hist(y,10);
title('Bins = 10');
subplot(2,1,2);
hist(y,50);
title('Bins = 50');
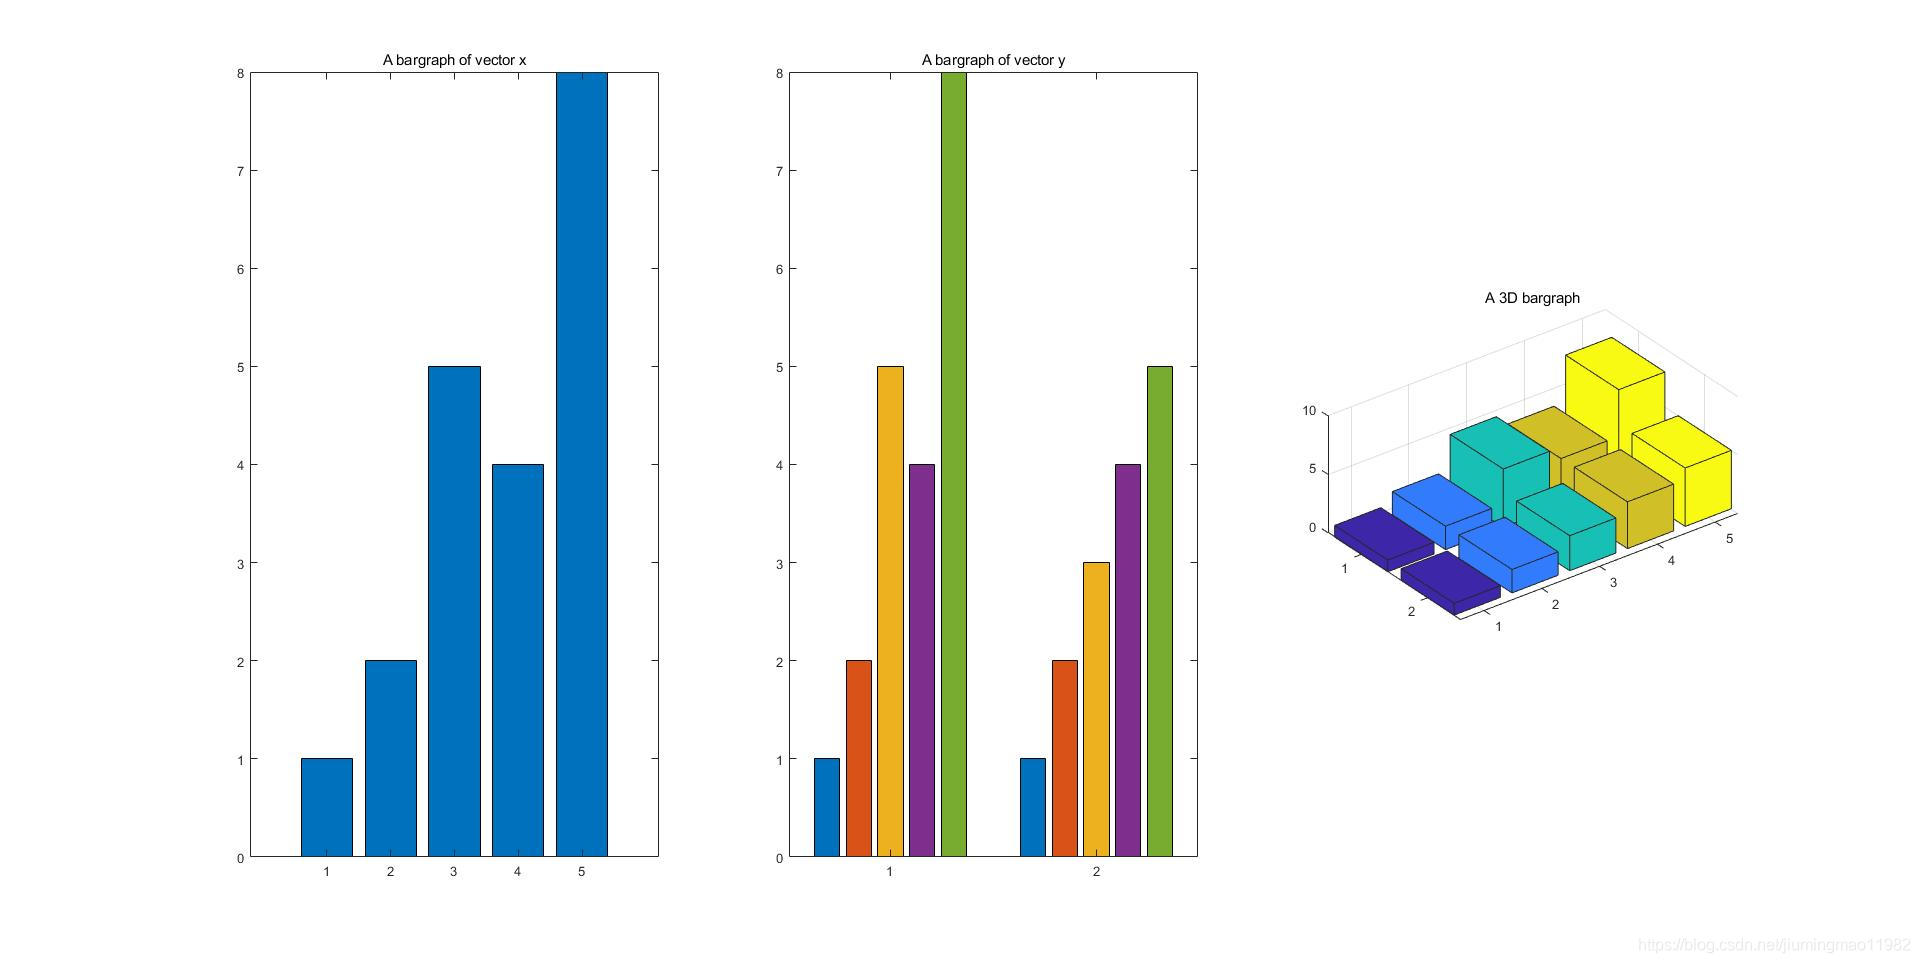
%% Bar Charts
x=[1 2 5 4 8];
y=[x;1:5];
subplot(1,3,1);
bar(x);
title('A bargraph of vector x');
subplot(1,3,2);
bar(y);
title('A bargraph of vector y');
subplot(1,3,3);
bar3(y);
title('A 3D bargraph');
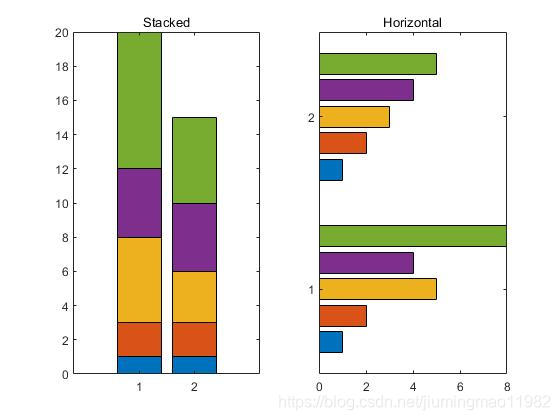
%% Stacked and Horizontal bar
x=[1 2 5 4 8];
y=[x;1:5];
subplot(1,2,1);
bar(y,'stacked');
title('Stacked');
subplot(1,2,2);
barh(y);
title('Horizontal');
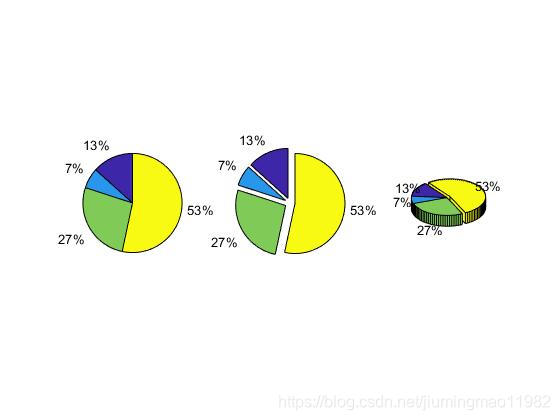
%% Pie Charts
a=[10 5 20 40];
subplot(1,3,1);
pie(a);
subplot(1,3,2);
pie(a,[1,1,1,1]);
subplot(1,3,3);
pie3(a,[0,0,0,1])
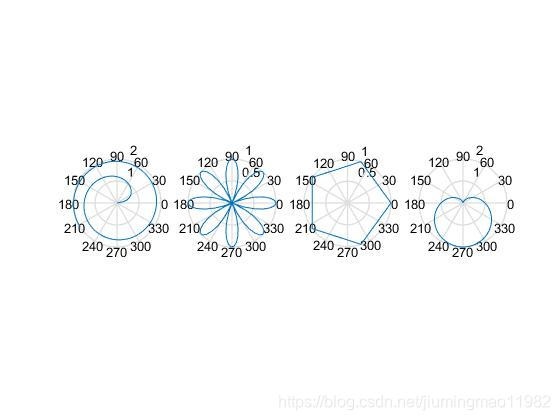
%% 极坐标
x=1:100
theta=x/10
r=log10(x);
subplot(1,4,1);
polar(theta,r);

theta = linspace(0,2*pi);
r = cos(4*theta);
subplot(1,4,2);
polar(theta,r);

theta = linspace(0,2*pi,6);
r = ones(1,length(theta));
subplot(1,4,3);
polar(theta,r);

theta= linspace(0,2*pi);
r=1-sin(theta);
subplot(1,4,4);
polar(theta,r);
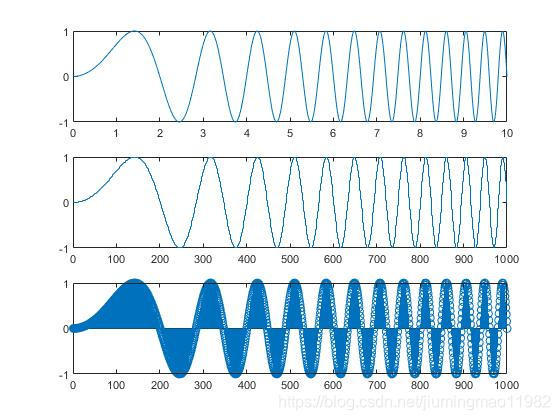
%%
x=linspace(0,10,1000)
y=sin((x.^2)*pi/4)
subplot(3,1,1);
plot(x,y)
subplot(3,1,2);
stairs(y);
subplot(3,1,3);
stem(y);
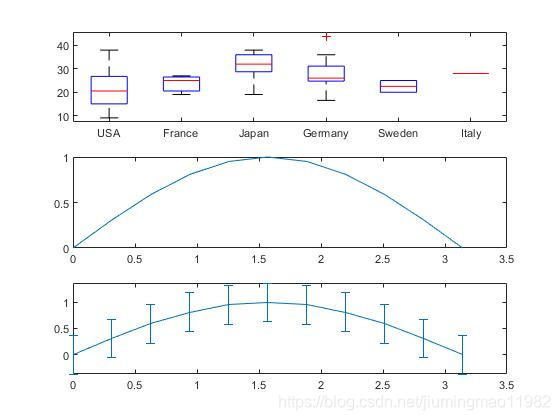
%%
subplot(3,1,1);
load carsmall
boxplot(MPG,Origin);
x=0:pi/10:pi
y=sin(x);
subplot(3,1,2);
plot(x,y);
e=std(y)*ones(size(x));
subplot(3,1,3);
errorbar(x,y,e);
%%
t=(1:2:15)*pi/8;
x=sin(t)
y=cos(t)
fill(x,y,'r');
axis square off;
thc=text(0,0,'STOP','Color','w','FontSize',80,'FontWeight','bold','HorizontalAlignment','center');

%%
clc
t=(1:1:4)*pi/2;
x=sin(t);
y=cos(t);
thc=fill(x,y,'y','EdgeColor','k','LineWidth',4)
axis square off;
text(0,0,'WAIT','Color','k','FontSize',68,'FontWeight','bold','HorizontalAlignment','center')

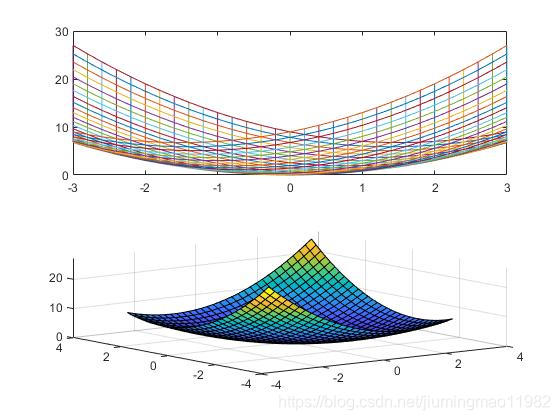
%% 3D绘制
[x, y] = meshgrid(-3:.2:3,-3:.2:3);
z = x.^2 + x.*y + y.^2;
subplot(2,1,1);
hold on;
plot(x,z);
plot(y,z);
subplot(2,1,2);
surf( x, y, z);
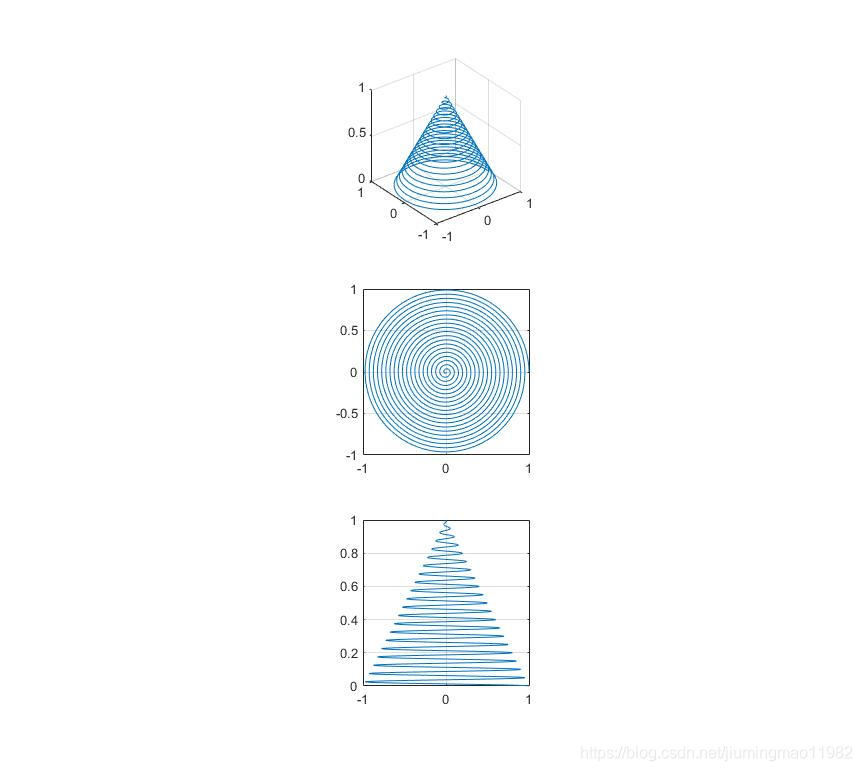
%% 3D Line
 turns = 40*pi;
t = linspace(0,turns,4000);
x = cos(t).*(turns-t)./turns;
y = sin(t).*(turns-t)./turns;
z = t./turns;
subplot(3,1,1);
plot3(x,y,z);
grid on;axis square;
subplot(3,1,2);
plot(x,y);
grid on;axis square;
subplot(3,1,3);
plot(x,z);
grid on;axis square;


 本文详细介绍了Matlab中各种绘图函数的使用方法,并通过实例展示了如何利用Matlab进行数据可视化,包括2D和3D图形的绘制,是学习和提升Matlab绘图技能的好帮手。


 1万+
1万+

 被折叠的 条评论
为什么被折叠?
被折叠的 条评论
为什么被折叠?
 到【灌水乐园】发言


