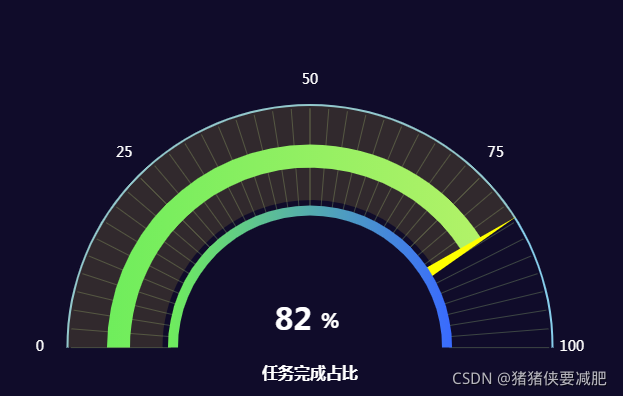
仪表盘echarts图(附图与代码)

var datas = {
    value: 82,
    title: "任务完成占比",
    type: 1,
    radiusType: 1
};
let  startAngle=180,endAngle=0;
var fontColor = "#00f6f7";
var seriesName = "";
let noramlSize = 16;
let state = "";
let center = ["50%", "55%"];
let wqradius = 0,
    nqradius = 0,
    kdradius;
    wqradius = "60%";
    nqradius = "60%";
    kdradius = "90%";
let min=0,max=100;
let nqColor = [
    [
        datas.value/100,
        "rgba(201, 174, 60,0.2)"
    ],
    [
        1,
       "rgba(3, 169, 159,0)"
    ]
];

let wqColor = "rgba(22, 138, 255, 0.9)";
let circleLineW=2;
myChart.setOption({
    // backgroundColor:"#000",
    title: {
        show: true,
        x: "center",
        bottom: "40%",
        text: datas.title,
        textStyle: {
            // fontWeight: "700",
            fontSize: 16,
            color: '#fff'
        }
    },
    tooltip: {
        show: false
    },
    series: [
        {
            type: "gauge",
            radius: "70%",
            splitNumber: 4, //刻度数量
            min: 0,
            max: 100,
            startAngle,
            endAngle,
            center,
            pointer: {
              show: false,
            },
            // data: dataArr,
            title: {
              show: false,
            },
            axisLine: {
              show: false,
              lineStyle: {
                color: "rgb(4, 145, 139)",
                width: 35,
                shadowOffsetX: 0,
                shadowOffsetY: 0,
                opacity: 1,
              },
            },
            axisTick: {
              show: true,
              splitNumber: 10,
              length: 100,//刻度线长度
              lineStyle: {
                width: 1,
                color: "#3c4543",
              }, 
            },
            splitLine: {
              length:0, //刻度节点线长度
              lineStyle: {
                width: 1,
                color: "#20c998",
              }, //刻度节点线
            },
            axisLabel: {
              show: true,
              distance:0,
              textStyle: {
                    color: '#ffffff',
                    fontSize: "14",
                    // fontWeight: "bold"
                }
            },
            detail: {
              show: 0,
            },
            animationDuration: 4000,
          },{
            name: "白色圈刻度",
            type: "gauge",
            radius: kdradius,
            center,
            startAngle, //刻度起始
            endAngle, //刻度结束
            z: 7,
            splitNumber: 5,
            axisTick: {
                show: false
            },
            splitLine: {
                show: false
            },
            axisLabel: {
                show: false,
                color: fontColor,
                fontSize: noramlSize,
                formatter: "{value}%"
            }, //刻度节点文字颜色
            pointer: {
                show: false
            },
            axisLine: {
                show: false
            },
            detail: {
                show: false
            }
        },
        {
            name: "外层圈", //刻度背景
            type: "gauge",
            z: 2,
            radius: wqradius,
            startAngle,
            endAngle,
            center, //整体的位置设置
            axisLine: {
                // 坐标轴线
                lineStyle: {
                    // 属性lineStyle控制线条样式
                    color: [
                        [1, 'skyblue']
                    ],
                    width: circleLineW,
                    opacity: 1 //刻度背景宽度
                }
            },
            splitLine: {
                show: false
            },
            axisLabel: {
                show: false
            },
            pointer: {
                show: false
            },
            axisTick: {
                show: false
            },
            detail: {
                show: 0
            }
        },
        {
            name: "指针",
            type: "gauge",
            z: 9,
            radius: "100%",
            startAngle,
            endAngle,
            center, //整体的位置设置
            axisLine: {
                show:false,
            },
            axisTick: {
                show: false
            },
            splitLine: {
                show: false
            },
            axisLabel: {
                show: false
            },
            min,
            max,
            //指针样式位置
            pointer: {
                show: true,
                width: 5,
                length: "25%",
                offsetCenter: [0,-142],
            },
            itemStyle: {
                normal: {
                    color: 'yellow'
                }
            },
            detail: {
                show: true,
                offsetCenter: [0, -25],
                formatter: [
                    "{value|" + (datas.value) + " }"+"{percent|" + '%' + " }"
                ].join("\n"),
                rich: {
                    value: {
                        fontSize: 30,
                        lineHeight: 10,
                        color: '#ffffff',
                        fontWeight: "700"
                    },
                    percent: {
                        fontSize: 20,
                        lineHeight: 10,
                        color: '#ffffff',
                        fontWeight: "700"
                    }
                }
            },
            data: [datas.value] //指针位置
        },
        {
            name: "内层盘",
            type: "gauge",
            z: 6,
            radius: nqradius,
            startAngle,
            endAngle,
            center, //整体的位置设置
            axisLine: {
                lineStyle: {
                    // 属性lineStyle控制线条样式//控制外圈位置
                    color: nqColor,
                    width: 96,
                    opacity: 0.9 //控制外圈位置,颜色,宽度,透明度
                }
            },
            axisTick: {
                show: false
            },
            splitLine: {
                show: false
            },
            axisLabel: {
                show: false
            },
            pointer: {
                show: false
            },
            detail: {
                show: 0
            }
        },
        {
            name: "中间小环",
            type: "gauge",
            z: 6,
            radius: "50%",
            startAngle,
            endAngle,
            center: center, //整体的位置设置
            axisLine: {
                lineStyle: {
                    // 属性lineStyle控制线条样式//控制外圈位置
                   color: [
                        [
                            datas.value/100, new echarts.graphic.LinearGradient(
                                0, 0, 1, 0, [{
                                        offset: 0,
                                        color: '#6fed5c'
                                    },
                                    {
                                        offset: 1,
                                        color: '#b2f268'
                                    }
                                ]
                            )]
                    ],
                    width:23,
                    // opacity: 0.9 //控制外圈位置,颜色,宽度,透明度
                }
            },
            axisTick: {
                show: false
            },
            splitLine: {
                show: false
            },
            axisLabel: {
                show: false
            },
            pointer: {
                show: false
            },
            detail: {
                show: 0
            }
        },
        {
            name: "内层小环",
            type: "gauge",
            z: 10,
            radius: "35%",
            startAngle,
            endAngle,
            center: center, //整体的位置设置
            axisLine: {
                lineStyle: {
                    // 属性lineStyle控制线条样式//控制外圈位置
                   color: [
                        [1, new echarts.graphic.LinearGradient(
                                0, 0, 1, 0, [{
                                        offset: 0,
                                        color: '#6fed5c'
                                    },
                                    {
                                        offset: 1,
                                        color: '#396aff'
                                    }
                                ]
                            )]
                    ],
                    width:10,
                    // opacity: 0.9 //控制外圈位置,颜色,宽度,透明度
                }
            },
            axisTick: {
                show: false
            },
            splitLine: {
                show: false
            },
            axisLabel: {
                show: false
            },
            pointer: {
                show: false
            },
            detail: {
                show: 0
            }
            
        }
    ]
});

在这里插入图片描述

var bgColor = "#222939"
var highlight = '#05c7c9'
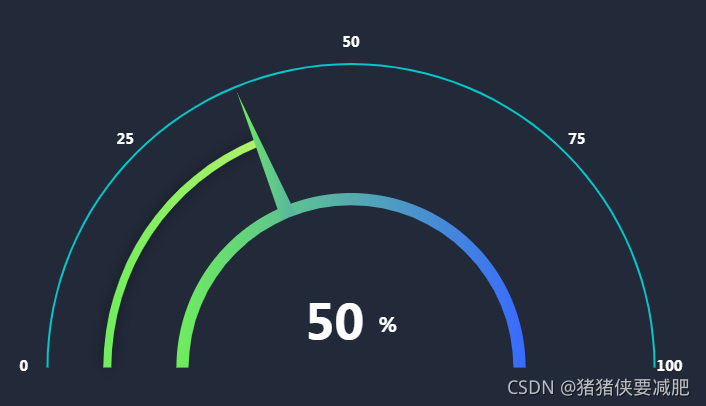
var value = 1.5
    
option = {
    backgroundColor: bgColor,
    title: {
        text: '{a|'+ 50+ ' ' +'}{c|%}',
        x: 'center',
        y: 'center',
        textStyle: {
            rich:{
                a: {
                    fontSize: 48,
                    color: '#ffffff',
                    fontWeight:'bold'
                },
                
                c: {
                    fontSize: 20,
                    color: '#ffffff',
                    fontWeight:'bold'
                    // padding: [5,0]
                }
            }
        }
    },
    series: [
        {
            name: '刻度',
            type: 'gauge',
            center: ['50%', '55%'], // 默认全局居中  
            splitNumber: 4, //刻度数量
            min: 0,
            max: 100,
            startAngle: 180,
            endAngle: 0,
            clockwise: true,
            axisLine: {
                show: true,
                lineStyle: {
                    width: 2,
                    shadowBlur: 0,
                    color: [
                        [1, highlight]
                    ]
                }
            },
            axisTick: {
                show: false,
                
                // lineStyle: {
                   
                //     color: highlight,
                //     width: 1
                // },
                // length: 8,
                // splitNumber: 10
            },
            splitLine: {
                show: false,
                length: -7,
                lineStyle: {
                    color: highlight,
                }
            },
            axisLabel: {
                distance: -20,
                textStyle: {
                    color: '#ffffff',
                    fontSize: "14",
                    fontWeight: "bold"
                }
            },
            pointer: { //仪表盘指针
                show: 0
            },
            detail: {
                show: false
            }
        },
        {
            name: '标尺',
            center: ['50%', '55%'], // 默认全局居中 
            type: 'gauge',
            radius: '61%',
            splitNumber: 0, //刻度数量
            startAngle: 180,
            endAngle: 0,
            axisLine: {
                lineStyle: {
                    shadowColor: 'rgba(0, 0, 0, 0.4)',
                    shadowBlur: 15,
                    color: [
                        [
                            (value/4), new echarts.graphic.LinearGradient(
                                0, 0, 1, 0, [{
                                        offset: 0,
                                        color: '#6fed5c'
                                    },
                                    {
                                        offset: 1,
                                        color: '#b2f268'
                                    }
                                ]
                            )
                        ],
                    ]
                }
            },
            axisLabel: {
                show: false
            },
            axisTick: {
                show: false
            },
            splitLine: {
                show: false
            },
            detail: {
                show: false
            },
            pointer: {
                show: true
            }
        },
       
        {
            name: '数值',
            type: 'gauge',
            startAngle: 180,
            endAngle: 0,
            radius: '43%',
            center: ['50%', '55%'], // 默认全局居中  
            min: 0,
            max: 4,
            splitNumber: 0,
            axisLine: { // 坐标轴线  
                lineStyle: {
                    color: [
                        [
                            1, new echarts.graphic.LinearGradient(
                                0, 0, 1, 0, [{
                                        offset: 0,
                                        color: '#6fed5c'
                                    },
                                    {
                                        offset: 1,
                                        color: '#396aff'
                                    }
                                ]
                            )
                        ],
                    ], // 属性lineStyle控制线条样式  
                    width: '1%'
                }
            },

            axisLabel: { // 坐标轴小标记  
                show: false
            },
            splitLine: { // 分隔线  
                lineStyle: { // 属性lineStyle(详见lineStyle)控制线条样式  
                    width: 0
                }
            },
            pointer: { // 分隔线 指针  
                color: 'red',
                width: '10%',
                length: '170%'
            },
            detail: {
                show: true
            },
            data: [{
                name: "",
                value: value
            }],
            z: 2
        },
        {
            name: '遮罩',
            tooltip:{
                show:true
            },
            type: 'pie',
            radius: '40%',
            center: ['50%', '55%'], // 默认全局居中
            hoverAnimation:false,
            itemStyle:{
                normal:{
                    color: bgColor
                },
                emphasis:{
                    color: bgColor
                }
            },
            labelLine:{
                normal:{
                    show:false
                }
            },
            animation:false,
            data: [1.9],
            
        }
    ]
};

在这里插入图片描述

<think>好的,用户问的是主附图的定义及用法,可能是在学习表分析或者技术分析相关的内容。需要先明确主附图的基本概念,然后解释它们在不同场景下的应用方法。 首先,主通常指的是主要显示的表,比如股票的价格走势,包含K线、成交量等核心数据。附图则是辅助性的表,如MACD、RSI等技术指标,用来补充主的信息。需要查证主附图在常见分析软件中的具体应用,比如在TradingView或者同花顺中的例子。 然后,用户可能需要了解如何结合主附图进行分析。例如,主显示价格趋势,附图显示动量指标,两者结合判断买卖信号。需要找到实际案例或者分析方法,说明如何有效利用两者。 还要注意不同领域可能有不同的定义,比如在学术论文中,主可能是主要结果,附图为补充数据,但用户的问题更可能指向金融或技术分析领域。需要确认这一点,避免偏离方向。 最后,确保回答结构清晰,分点说明定义、用法,并给出具体例子。同时,按照用户要求,生成相关问题时要基于主附图的关系、技术指标选择以及软件设置方法等方面,确保问题相关且有延伸性。</think>主附图是数据可视化及技术分析领域的重要概念,在金融交易、学术研究等场景应用广泛。 **定义作用** - 主指占据主要显示区域的核心表,通常呈现基础数据(如股票价格K线、时间序列数据曲线)。证券分析中主常包含开盘价、收盘价、最高价、最低价等关键信息 - 附图位于主下方或侧边区域,显示衍生指标或辅助数据(如MACD、RSI、成交量柱状)。数学表达常用$Volume_t = \sum_{i=1}^n Trade_i$计算时段成交量 **典型应用场景** 股票交易软件中,主展示价格走势,附图显示技术指标。TradingView平台支持同时配置多个附图窗口,可通过以下代码设置指标组合: ```pinescript //@version=5 indicator("Multi-Chart", overlay=false) plot(close, title="Main Chart") lowerChart = pane.bottom() plot(ta.rsi(close, 14), title="RSI", pane=lowerChart) ``` **分析方法** 主附图需结合验证信号。当主出现头肩顶形态时,若附图MACD指标同时形成顶背离(满足$MACD_{histogram} < 0$且价格创新高),可增强反转判断的可信度。不同时间周期需同步观察,日线主配合小时线附图能捕捉更精确的买卖点。 **配置建议** 多数分析软件支持自定义布局。建议主占比60%-70%界面空间,附图按指标类型分组显示。避免超过3个附图导致信息过载,相关性强的指标(如布林带标准差)可叠加显示。
评论 1
成就一亿技术人!
拼手气红包6.0元
还能输入1000个字符
 
红包 添加红包
表情包 插入表情
 条评论被折叠 查看
添加红包

请填写红包祝福语或标题

红包个数最小为10个

红包金额最低5元

当前余额3.43前往充值 >
需支付:10.00
成就一亿技术人!
领取后你会自动成为博主和红包主的粉丝 规则
hope_wisdom
发出的红包
实付
使用余额支付
点击重新获取
扫码支付
钱包余额 0

抵扣说明:

1.余额是钱包充值的虚拟货币,按照1:1的比例进行支付金额的抵扣。
2.余额无法直接购买下载,可以购买VIP、付费专栏及课程。

余额充值