


 本文介绍了一种使用ECharts库实现多环形气泡图的方法,通过设置不同环形图的半径和位置,形成独特的视觉效果,适用于展示投资完成情况等数据对比场景。
前言
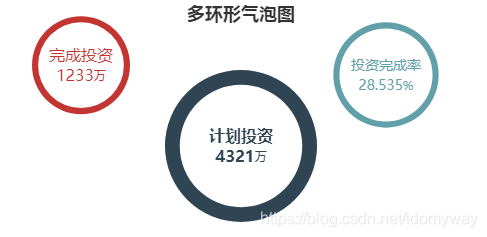
通过设置多个环形图的半径和位置组合实现气泡图。
实现效果
###实现代码
<!DOCTYPE html>
<html lang="en">
<head>
    <meta charset="UTF-8">
    <title>Title</title>
    <style>
        html,body{
            height: 100%;
        }
        *{
            margin: 0px;
            height: 0px;
        }
        #chartDiv{
            width: 500px;
            height: 245px;
            border: 1px solid red;
        }
    </style>
    <script src="js/echarts.min.js"></script>
</head>
<body>
<div id="chartDiv"></div>
    <script>
        var chartDiv = echarts.init(document.getElementById('chartDiv'));
        var option = {
            title:{
                text:"多环形气泡图",
                left:"center"
            },
            series: [
                {
                    type:'pie',
                    center: ['18%', '27%'],
                    radius: ['35%', '40%'],
                    itemStyle:{
                        color:"#669966"
                    },
                    label: {
                        normal: {
                            show: true,
                            position: 'center',
                            formatter: "{b|{b}}\n{b|{c}}万",
                            rich: {
                                b: {
                                    fontSize:16,
                                    lineHeight: 20,
                                    align: 'center'
                                },
                            }
                        },
                        emphasis: {
                            show: true,
                            textStyle: {
                                fontSize: '14',
                            }
                        }
                    },
                    data:[
                        {value:1233, name:'完成投资'},
                    ]
                },
                {
                    type:'pie',
                    center: ['50%', '60%'],
                    radius: ['50%', '58%'],
                    itemStyle:{
                        color:"#199ED8"
                    },
                    label: {
                        normal: {
                            show: true,
                            position: 'center',
                            formatter: "{b|{b}}\n{b|{c}}万",
                            rich: {
                                b: {
                                    fontSize:16,
                                    fontWeight:"bold",
                                    lineHeight: 20,
                                    align: 'center'
                                },
                            }
                        },
                        emphasis: {
                            show: true,
                            textStyle: {
                                fontSize: '14',
                            }
                        }
                    },
                    data:[
                        {value:4321, name:'计划投资'},
                    ]
                },
                {
                    type:'pie',
                    center: ['79%', '31%'],
                    radius: ['38%', '43%'],
                    itemStyle:{
                        color:"#FF9966"
                    },
                    label: {
                        normal: {
                            show: true,
                            position: 'center',
                            formatter: "{b|{b}}\n{b|{c}}%",
                            rich: {
                                b: {
                                    fontSize:14,
                                    lineHeight: 20,
                                    align: 'center'
                                },
                            }
                        },
                        emphasis: {
                            show: true,
                            textStyle: {
                                fontSize: '14',
                            }
                        }
                    },
                    data:[
                        {value:(1233/4321*100).toFixed(3), name:'投资完成率'},
                    ]
                }
            ]
        };
        chartDiv.setOption(option)
    </script>

</body>
</html>


 696
696

 被折叠的 条评论
为什么被折叠?
被折叠的 条评论
为什么被折叠?
 到【灌水乐园】发言


