


 本文深入解析Prometheus配置文件prometheus.yml的各项参数,包括全局配置、抓取配置、证书配置及报警配置等内容,帮助读者理解如何有效配置Prometheus监控系统。
目录
上一篇《hualinux 进阶 prom 1-2.2:prometheus安装》说了prom的安装,添加了node Exporter、Grafana图形,在grafana中我直接添加官网自己的Prometheus Dashboard 仪表盘,这样就不用自己自定义添加监控了。
如现成的监控没有满足要求可以自定义添加监控指标metrics,但是在自定义监控指标之前,我们还得学习一些基础知识,所以在这里先讲一下prom和node exporter基础知识
本篇将讲prom配置文件
一、关于prometheus配置
学习prom肯定需要对prom的配置,这里我就不再详细解释了,可以直接看官方的prome配置

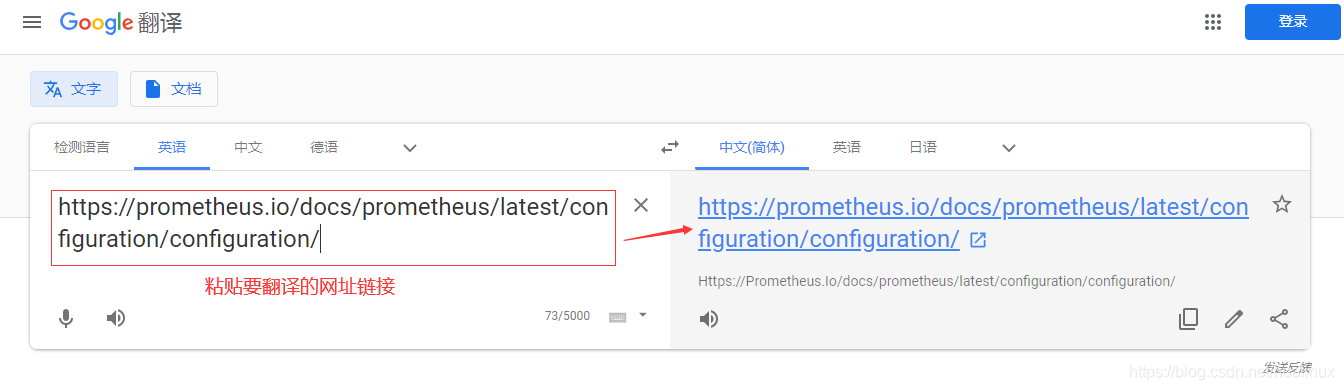
翻译操作如下:
打开歌谷翻译
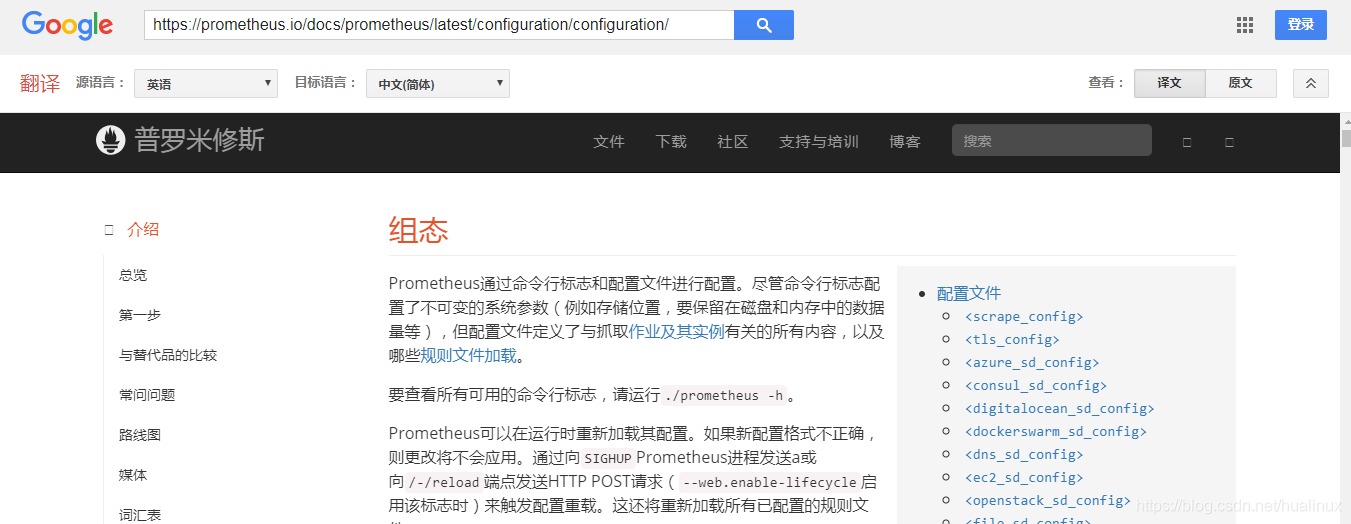
点右边的链接,会弹出如下对话框,这样就自动变帮翻译成中文了,翻译的精确度还是挻高的
二、prometheus.yml配置文件
2.1 prom命令参数
在上一章在启动服务的时候我添加了一些参数,再回顾一下,如下:
| 选项 | 说明 |
|---|---|
| ExecStart=/disk1/app/prometheus/prometheus | 启动运行Prometheus程序所在的路径 |
| --config.file=/disk1/app/prometheus/prometheus.yml | 指定prometheus.yml配置文件路径 |
| --storage.tsdb.path=/disk1/promData | 指定监控指标数据存储的路径 |
| --storage.tsdb.retention.time=15d | 历史数据最大保留时间,默认15天 |
| --web.console.templates=/disk1/app/prometheus/consoles | 指定控制台模板目录路径 |
| --web.console.libraries=/disk1/app/prometheus/console_libraries | 指定控制台库目录路径 |
| --web.max-connections=512 | 设置最大同时连接数 |
| --web.external-url="http:// 192.168.128.82:9090" | 用于生成返回Prometheus的相对和绝对链接地址,可以在后续告警通知内容中直接点击链接地址访问Prometheus Web UI 其格式: http:// {ip或者域名}:9090 |
| --web.listen-address=:9090 | Prometheus默认监控端口 |
更多的参数说明可以使用如下命令
prometheus --help2.2 配置文件prometheus.yml
prometheus.yml中配置了很多属性 ;主要分为默认可以从,全局配置、告警配置、规则配置、数据拉取配置、远程可读存储、远程可写存储、服务发现、如下所示:
global:
  #默认情况下抓取目标的频率.
  [ scrape_interval: <duration> | default = 1m ]

  # 抓取超时时间.
  [ scrape_timeout: <duration> | default = 10s ]

  # 评估规则的频率.
  [ evaluation_interval: <duration> | default = 1m ]

  # 与外部系统通信时添加到任何时间序列或警报的标签
  #(联合,远程存储,Alertma# nager).
  external_labels:
    [ <labelname>: <labelvalue> ... ]

# 规则文件指定了一个globs列表.
# 从所有匹配的文件中读取规则和警报.
rule_files:
  [ - <filepath_glob> ... ]

# 抓取配置列表.
scrape_configs:
  [ - <scrape_config> ... ]

# 警报指定与Alertmanager相关的设置.
alerting:
  alert_relabel_configs:
    [ - <relabel_config> ... ]
  alertmanagers:
    [ - <alertmanager_config> ... ]

# 与远程写入功能相关的设置.
remote_write:
  [ - <remote_write> ... ]

# 与远程读取功能相关的设置.
remote_read:
  [ - <remote_read> ... ]
2.3 抓取配置<scrape_config>
<scrape_config>抓取配置,部分指定一组描述如何刮除它们的目标和参数。 在一般情况下,一个scrape配置指定单个作业。在高级配置中 ,这可能会改变。
目标可以通过static configs参数静态配置,也可以使用其中一种支持的服务发现机制动态发现。
其中job_ name 在所有scrape配置中必须是唯一的。<scrape_config>默认配置相关的参数:
# 默认分配给已抓取指标的job名称。
job_name: <job_name>

# 从job中抓取目标的频率.
[ scrape_interval: <duration> | default = <global_config.scrape_interval> ]

# 抓取此job时,每次抓取超时时间.
[ scrape_timeout: <duration> | default = <global_config.scrape_timeout> ]

# 从目标获取指标的HTTP资源路径.
[ metrics_path: <path> | default = /metrics ]

# honor_labels控制Prometheus如何处理已经存在于已抓取数据中的标签与Prometheus将附加服务器端的标签之间的冲突("job"和"instance"标签,手动配置的目标标签以及服务发现实现生成的标签)。
#
# 如果honor_labels设置为"true",则通过保留已抓取数据的标签值并忽略冲突的服务器端标签来解决标签冲突。
#
# 如果honor_labels设置为"false",则通过将已抓取数据中的冲突标签重命名为"exported_ <original-label>"(例如"exported_instance","exported_job")然后附加服务器端标签来解决标签冲突。 这对于联合等用例很有用,其中应保留目标中指定的所有标签。
#
# 请注意,任何全局配置的"external_labels"都不受此设置的影响。 在与外部系统通信时,它们始终仅在时间序列尚未具有给定标签时应用,否则将被忽略。
#
[ honor_labels: <boolean> | default = false ]

# 配置用于请求的协议方案.
[ scheme: <scheme> | default = http ]

# 可选的HTTP URL参数.
params:
  [ <string>: [<string>, ...] ]

# 使用配置的用户名和密码在每个scrape请求上设置`Authorization`标头。 password和password_file是互斥的。
basic_auth:
  [ username: <string> ]
  [ password: <secret> ]
  [ password_file: <string> ]

# 使用配置的承载令牌在每个scrape请求上设置`Authorization`标头。 它`bearer_token_file`和是互斥的。
[ bearer_token: <secret> ]

# 使用配置的承载令牌在每个scrape请求上设置`Authorization`标头。 它`bearer_token`和是互斥的。
[ bearer_token_file: /path/to/bearer/token/file ]

# 配置scrape请求的TLS设置.
tls_config:
  [ <tls_config> ]

# 可选的代理URL.
[ proxy_url: <string> ]

# Azure服务发现配置列表.
azure_sd_configs:
  [ - <azure_sd_config> ... ]

# Consul服务发现配置列表.
consul_sd_configs:
  [ - <consul_sd_config> ... ]

# DNS服务发现配置列表。
dns_sd_configs:
  [ - <dns_sd_config> ... ]

# EC2服务发现配置列表。
ec2_sd_configs:
  [ - <ec2_sd_config> ... ]

# OpenStack服务发现配置列表。
openstack_sd_configs:
  [ - <openstack_sd_config> ... ]

# 文件服务发现配置列表。
file_sd_configs:
  [ - <file_sd_config> ... ]

# GCE服务发现配置列表。
gce_sd_configs:
  [ - <gce_sd_config> ... ]

# Kubernetes服务发现配置列表。
kubernetes_sd_configs:
  [ - <kubernetes_sd_config> ... ]

# Marathon服务发现配置列表。
marathon_sd_configs:
  [ - <marathon_sd_config> ... ]

# AirBnB的神经服务发现配置列表。
nerve_sd_configs:
  [ - <nerve_sd_config> ... ]

# Zookeeper Serverset服务发现配置列表。
serverset_sd_configs:
  [ - <serverset_sd_config> ... ]

# Triton服务发现配置列表。
triton_sd_configs:
  [ - <triton_sd_config> ... ]

# 此job的标记静态配置目标列表。
static_configs:
  [ - <static_config> ... ]

# 目标重新标记配置列表。
relabel_configs:
  [ - <relabel_config> ... ]

# 度量标准重新配置列表。
metric_relabel_configs:
  [ - <relabel_config> ... ]

# 对每个将被接受的样本数量的每次抓取限制。
# 如果在度量重新标记后存在超过此数量的样本,则整个抓取将被视为失败。 0表示没有限制。
[ sample_limit: <int> | default = 0 ]
2.3.1 静态配置<static_config>
正常里面我们使用经常配置文件还是比较多的,在我们服务器的数量不是很多的场景下,我们可以使用静态的方式来进行配置,比如上篇 prometheus配置中关联node exporter 配置中,我在prometheus.yml中添加的:
  - job_name: 'centos8'
    static_configs:
    - targets: ['192.168.3.82:9100','192.168.3.21:9100']
在web中看到的状态为:

2.3.2 动态配置<file_sd_config>
动态配置 <file_sd_config> 基于文件的服务发现提供了一种配置静态目标的更通用的方法,并用作插入自定义服务
发现机制的接口.
它读取一-组包含零个或多个static_ config的列表的文件.对所有已定义文件的更改将通过磁盘监视来检测并立即应用.文件可以以YAML或JSON格式提供.仅应用导致形成良好目标组的更改.根据官网<file_sd_config>的写法:
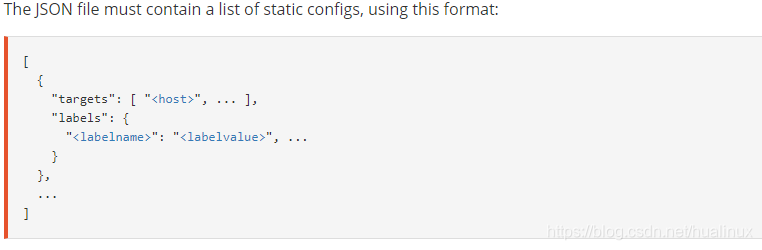
[
  {
    "targets": [ "<host>", ... ],
    "labels": {
      "<labelname>": "<labelvalue>", ...
    }
  },
  ...
]
下面我们以愿置文件作为例子,用上面的几个监控主机政导 下主机配置文件:
先建立相关配置json
mkdir -p /disk1/app/prometheus/conf.d
cd /disk1/app/prometheus/conf.d/
#以json的方式编写配置
cat>hualinux.json<<EOF
[
  {
    "targets": [ "192.168.3.82:9100","192.168.3.21:9100"],
    "labels": {
      "job": "centos8",
      "note": "测试"
     }
  }
]
EOF

#查看一下效果
[root@vm82 prometheus]# cat hualinux.json
[
  {
    "targets": [ "192.168.3.82:9100","192.168.3.21:9100"],
    "labels": {
      "job": "centos8",
      "note": "测试"
     }
  }
]
[root@vm82 conf.d]#
修改prometheus.yml中的配置文件,我这里的路径为 /disk1/app/prometheus/prometheus.yml
cd /disk1/app/prometheus/
#操作前先做一下配置文件的备份
cp prometheus.yml prometheus.yml.static

#还原最原始配置,我在原始配置的基础上再配置会更好些
[root@vm82 prometheus]# cp prometheus.yml.orig prometheus.yml
cp:是否覆盖'prometheus.yml'? yes
执行追加操作:
#追加配置
cat>>prometheus.yml<<EOF
# 动态发现,refresh_interval刷新时间间隔为60秒
- job_name: 'node-discorvery'
file_sd_configs:
- files:
- /disk1/app/prometheus/conf.d/*.json
refresh_interval: 60m
EOF
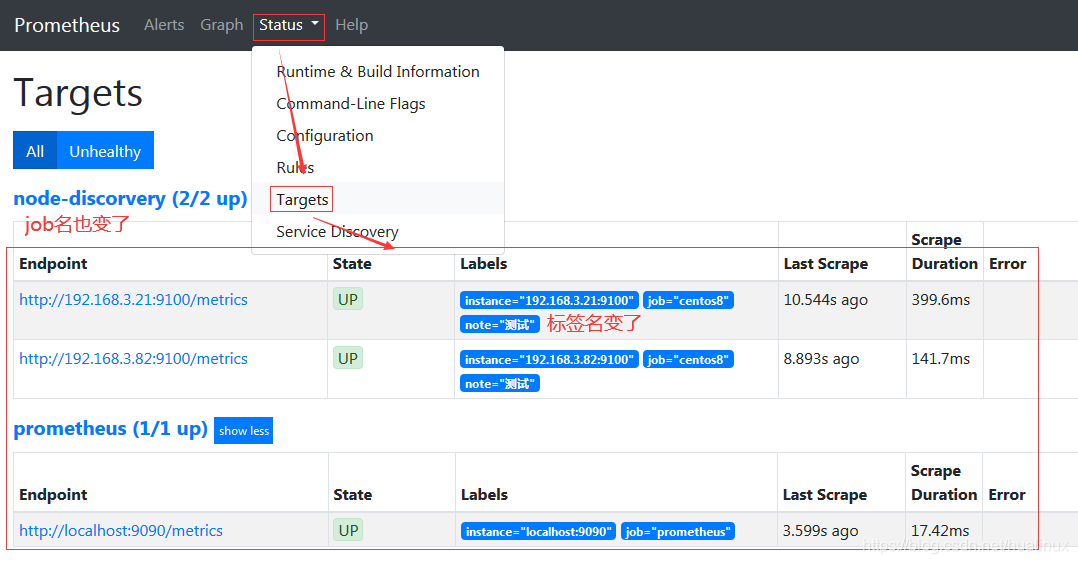
#查看效果,最后的就是我添加的,其它的没有改动
[root@vm82 prometheus]# cat prometheus.yml
# my global config
global:
scrape_interval: 15s # Set the scrape interval to every 15 seconds. Default is every 1 minute.
evaluation_interval: 15s # Evaluate rules every 15 seconds. The default is every 1 minute.
# scrape_timeout is set to the global default (10s).
# Alertmanager configuration
alerting:
alertmanagers:
- static_configs:
- targets:
# - alertmanager:9093
# Load rules once and periodically evaluate them according to the global 'evaluation_interval'.
rule_files:
# - "first_rules.yml"
# - "second_rules.yml"
# A scrape configuration containing exactly one endpoint to scrape:
# Here it's Prometheus itself.
scrape_configs:
# The job name is added as a label `job=<job_name>` to any timeseries scraped from this config.
- job_name: 'prometheus'
# metrics_path defaults to '/metrics'
# scheme defaults to 'http'.
static_configs:
- targets: ['localhost:9090']
# 动态发现,refresh_interval刷新时间间隔为60秒
- job_name: 'node-discorvery'
file_sd_configs:
- files:
- /disk1/app/prometheus/conf.d/*.json
refresh_interval: 60mPS:配置相关注解
file_sd_configs:指定Prometheus基于文件的服务发现配置使用的选项。
files,自定义的和Prometheus程序同级目录的targets目录,要被自动加载的所有.json格式的文件。当然也可以单独指定某一JOSN格式的文件。
refresh_interval:60m,自定义刷新间隔时间为60秒。
#重启prom
systemctl restart prometheus.service
systemctl status prometheus.service
#查看9090端口是否开启
netstat -alntp|grep -i listen|grep  9090
查看一下情况:ip:9090,我这里是192.168.3.82:9090
PS:
这一块在做服务发现的配置,主要 也是在prometheus里面做得最多的东西,相关的服务发现还有: DNS发现、Azure服务 发现、Consul服务发现、 EC2服务发现、OpenStack服务发现、GCE服务发现、Kubernetes服务 发现、Marathon服务 发现、AirBnB的神经服务发现、Zookeeper Serverset服务发现、Triton服务发现- 些服务发现组件, 具体可以参考官方配置文档
2.4 证书配置<tls_config>
<tls_config>主要是配置证书的
#用于验证API服务器证书的CA证书。
[ ca_file: <filename> ]

#用于服务器的客户端证书身份验证的证书和密钥文件。
[ cert_file: <filename> ]
[ key_file: <filename> ]

#ServerName扩展名,用于指示服务器的名称。
# https://tools.ietf.org/html/rfc4366#section-3.1
[ server_name: <string> ]

#禁用服务器证书的验证。
[ insecure_skip_verify: <boolean> ]
2.5 其它
2.5.1 rule_files
此片段指定报警规则财文件,prom根据这些规测信息, 会推送报警信息到altertmanage中
2.5.2 报警配置<alertmanager_config>
<alertmanager_config>部分指定Prometheus服务器向其发送警报的Alertmanager实例。它还提供参数以配置如何与这些Alertmanagers进行通信。
Alertmanagers可以通过static_ configs参 数静态配置,也可以使用其中一种支持的服务发现机制动态发现。此外, relabel_ configs允许从发现的实体中选择Alertmanagers ,并对使用的API路径提供高级修改,该路径通过__ alerts_ path__ 标签公开
2.5.3 远端读写
<remote_write>:指定后端的存储的写入api地址,<remote_read>指定后端的存储的读取api地址。
2.5.4 重新标记<relabel_config>
<relabel_config>,relabel为 Relabeling Label的意思 即重新标记。
重新标记是一种强大的工具,可以在抓取目标之前动态重写目标的标签集。每个抓取配置可以配置多个重新标记步骤。它们按照它们在配置 文件中的出现顺序应用于每个目标的标签集。标签默认在prometheus web console可以看到相关的标签: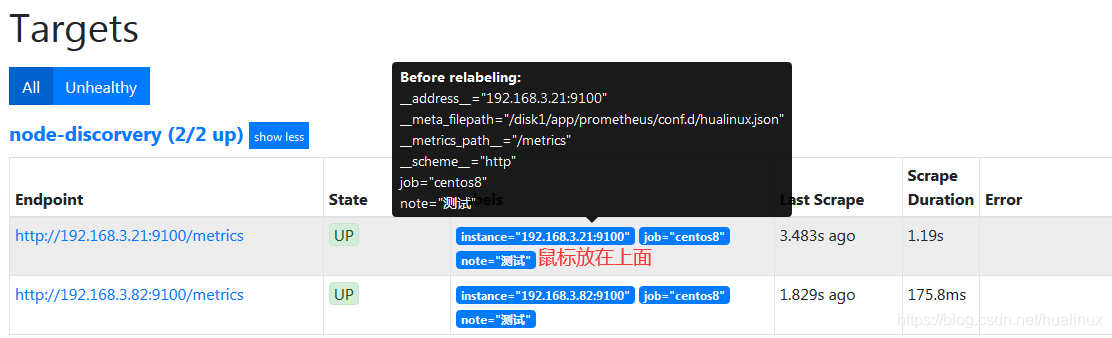
可以看到:
_address__:当前Target实例的访问地址<host> : <port>
_S cheme__ :采集目标服务访问地址的HTTP Scheme, HTTP或者HTTPS
metrics_ path_ :采集目标服务访问地址的访问路径
_param_<name>:采集任务目标服务的中包含的请求参数
默认情况下, arget以_作为前置 的标签是在系统内部使用的,因此这些标签不会被写入到样本数据中。所以在很多服务发现, k8s当中经常会用到这个方式把标签写入数据,<relabel_config>格式如下:
#源标签从现有标签中选择值。 它们的内容使用已配置的分隔符进行连接,并与已配置的正则表达式进行匹配,以进行替换,保留和删除操作。
[ source_labels: '[' <labelname> [, ...] ']' ]
#分隔符放置在连接的源标签值之间。
[ separator: <string> | default = ; ]
#在替换操作中将结果值写入的标签。
#替换操作是强制性的。 正则表达式捕获组可用。
[ target_label: <labelname> ]
#与提取的值匹配的正则表达式。
[ regex: <regex> | default = (.*) ]
#采用源标签值的散列的模数。
[ modulus: <uint64> ]
#如果正则表达式匹配,则执行正则表达式替换的替换值。 正则表达式捕获组可用。
[ replacement: <string> | default = $1 ]
#基于正则表达式匹配执行的操作。
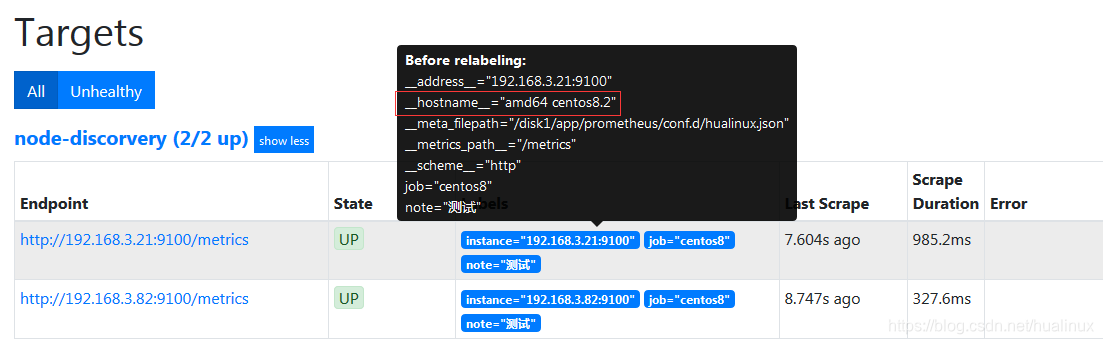
[ action: <relabel_action> | default = replace ]例子,我们修改标签,可以直接修改配置文件即可,比如我修改上面配置的hualinux.json,添加一个主机名标签
cd /disk1/app/prometheus/conf.d/
#为了方便,我重新写入文件
cat>hualinux.json<<EOF
[
  {
    "targets": [ "192.168.3.82:9100","192.168.3.21:9100"],
    "labels": {
      "job": "centos8",
      "note": "测试",
      "__hostname__": "amd64 centos8.2"
     }
  }
]
EOF

#查看效果
[root@vm82 conf.d]# cat hualinux.json
[
  {
    "targets": [ "192.168.3.82:9100","192.168.3.21:9100"],
    "labels": {
      "job": "centos8",
      "note": "测试",
      "__hostname__": "amd64 centos8.2"
     }
  }
]

#重启服务
systemctl restart prometheus
systemctl status prometheus
再看查看一下,红色为添加部分


 2万+
2万+

 被折叠的 条评论
为什么被折叠?
被折叠的 条评论
为什么被折叠?
 到【灌水乐园】发言


