


 本文详细介绍了Android系统中的Systrace工具,它用于性能数据采样和分析,特别是对Android关键子系统如SurfaceFlinger、SystemServer等的运行信息收集。Systrace基于Linux Kernel的ftrace功能,包括内核部分、数据采集和数据分析三大部分。通过atrace命令行工具,开发者可以跟踪系统I/O、内核工作队列、CPU负载等,并生成HTML报告。文章还提供了使用示例,包括设置trace缓冲区大小、跟踪类别、抓取时长等选项,并展示了如何解析和分析trace文件,以及使用Chrome浏览器查看丰富的trace信息。
折腾了几天终于把trace 底层原理搞明白了,后面整理一下写出来,今天开始整systrace,工作任务在身。其实我之前主要想研究bpf的,之所以研究trace,主要是因为Android的systrace使用的是trace,意想不到是trace底层源码读起来这么爽(有兴趣的可以去读一下^~^)。
概要
Systrace 是 Android4.1 中新增的性能数据采样和分析工具。它可帮助开发者收集 Android 关键子系统(如 SurfaceFlinger/SystemServer/Kernel/Input/Display 等 Framework 部分关键模块、服务,View系统等)的运行信息,并生成HTML报告。
Systrace 的功能包括跟踪系统的 I/O 操作、内核工作队列、CPU 负载以及 Android 各个子系统的运行状况等。在 Android 平台中,它主要由3部分组成:
- 内核部分:Systrace 利用了 Linux Kernel 中的 ftrace 功能。所以,如果要使用 Systrace 的话,必须开启 kernel 中和 ftrace 相关的模块。
- 数据采集部分:Android 定义了一个 Trace 类。应用程序可利用该类把统计信息输出给ftrace。同时,Android 还有一个 atrace 程序,它可以从 ftrace 中读取统计信息然后交给数据分析工具来处理。
- 数据分析工具:Android 提供一个 systrace.py( python 脚本文件,位于 Android SDK目录/platform-tools/systrace 中,其内部将调用 atrace 程序)用来配置数据采集的方式(如采集数据的标签、输出文件名等)和收集 ftrace 统计数据并生成一个结果网页文件供用户查看。 从本质上说,Systrace 是对 Linux Kernel中 ftrace 的封装。应用进程需要利用 Android 提供的 Trace 类来使用 Systrace.
关于 Systrace 的官方介绍和使用可以看这里:Systrace
简介
我是用的是RK3399基于android 7.1源码,由于客户现场问题,让现场人员定位,所以主要是用atrace,命令行方式。其他方式大家可以看参考文章Android Systrace,文章写得很全面。
atrace 是Android系统内置的工具,可以帮助我们使用后台方式抓取日志。下面简单介绍一下。
usage: atrace [options] [categories...]
options include:-a appname enable app-level tracing for a comma separated list of cmdlines 要抓取的app名字
-b N use a trace buffer size of N KB ,使用trace buffer大小,单位KB
-c trace into a circular buffer
-f filename use the categories written in a file as space-separated values in a line
-k fname,... trace the listed kernel functions
-n ignore signals
-s N sleep for N seconds before tracing [default 0] 延时N秒
-t N trace for N seconds [defualt 5] 抓取时长
-z compress the trace dump 压缩方式下面三个是用于循环抓取
--async_start start circular trace and return immediatly
--async_dump dump the current contents of circular trace buffer
--async_stop stop tracing and dump the current contents of circular
trace buffer
--stream stream trace to stdout as it enters the trace buffer
Note: this can take significant CPU time, and is best
used for measuring things that are not affected by
CPU performance, like pagecache usage.
--list_categories
list the available tracing categories 列出连接设备可用的跟踪类别参数
-o filename write the trace to the specified file instead of stdout. 定向到文件,默认输出stdout
我们看一下当前设备可以跟踪的类别。atrace --list_categories,比较清楚没有必要注释了。
gfx - Graphics
input - Input
view - View System
webview - WebView
wm - Window Manager
am - Activity Manager
sm - Sync Manager
audio - Audio
video - Video
camera - Camera
hal - Hardware Modules
app - Application
res - Resource Loading
dalvik - Dalvik VM
rs - RenderScript
bionic - Bionic C Library
power - Power Management
pm - Package Manager
ss - System Server
database - Database
network - Network
sched - CPU Scheduling
freq - CPU Frequency
idle - CPU Idle
load - CPU Load
memreclaim - Kernel Memory Reclaim
binder_driver - Binder Kernel driver
binder_lock - Binder global lock trace
使用
adb root 避免个别类别需要root权限,
adb shell atrace -z -b 40000 gfx input view wm am webview hal res dalvik rs sched freq idle disk mmc -t 10 > E:\android\sdk\platform-tools\systrace\trace_out
systrace.py --from-file trace_out -o trace.html
将trace文件拖进Chrome浏览器(必须的),可以看到丰富的trace信息了。
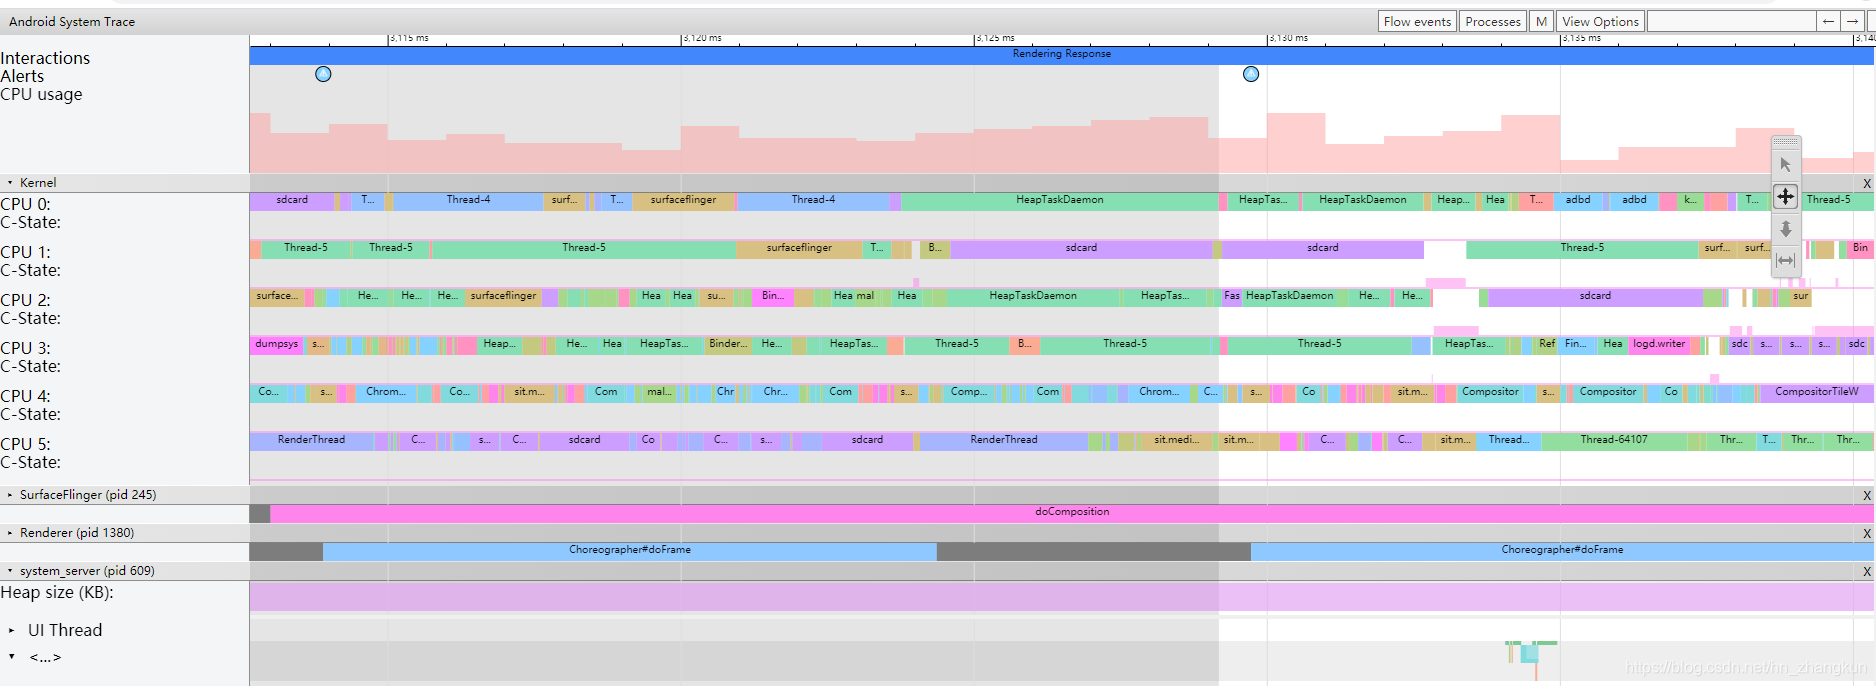
文件分析
在进程的上面有一条很细的进度条,包含了该线程的状态:
灰色: 睡眠。
蓝色: 可以运行(它可以运行,但还未被调度运行)。
绿色: 正在运行(调度程序认为它正在运行)。
红色: 不间断的睡眠(通常发生在内核锁上), 指出I / O负载,对于性能问题的调试非常有用
橙色: 由于I / O负载导致的不间断睡眠。
要查看不间断睡眠的原因(可从sched_blocked_reason跟踪点获取),请选择红色不间断睡眠切片。
快捷键使用
按键操作 作用
w 放大,[+shift]速度更快
s 缩小,[+shift]速度更快
a 左移,[+shift]速度更快
d 右移,[+shift]速度更快
f 放大当前选定区域
m 标记当前选定区域
v 高亮VSync
g 切换是否显示60hz的网格线
0 恢复trace到初始态,这里是数字0而非字母o
h 切换是否显示详情
/ 搜索关键字
enter 显示搜索结果,可通过← →定位搜索结果
` 显示/隐藏脚本控制台
? 显示帮助功能


 5589
5589

 被折叠的 条评论
为什么被折叠?
被折叠的 条评论
为什么被折叠?
 到【灌水乐园】发言


