


 本文介绍了如何在MATLAB中使用legend命令实现横排显示、选择性显示曲线以及在legend中添加带下标和希腊字母。通过设置'Interpreter'属性为'latex',可以利用LaTeX语法美化legend,使得下标效果更佳。使用Mathpix snipping tool工具能方便地将公式转换为LaTeX代码,提升图表的专业性。
1、横排
hl = legend('string1', 'string2');
set(hl,'Orientation','horizon')
2、只显示部分曲线的legend
h1 = plot(data1);
plot(data2);
h2 = plot(data3);
legend([h1,h2],'string1','string2');  % only show the legend of data1 and data3
另外一种方式是直接在plot中指定legend中的内容:
x = linspace(0,pi);
y1 = cos(x);
plot(x,y1,'DisplayName','cos(x)')

hold on
y2 = cos(2*x);
plot(x,y2,'DisplayName','cos(2x)')
hold off

legend
得到:

3、在legend中使用带下标 希腊字母
最简单的方法:
legend('\tau_{1}')
得到的效果:

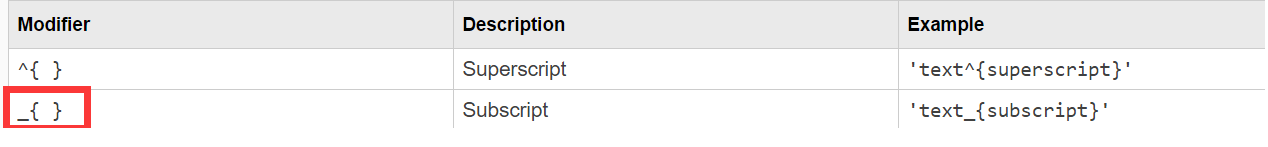
下标的符号如上图所示,希腊字母表间legend的帮助文件。
但是得到的字体明显不好看,特别是那个下标,简直丑爆了。但是,非常好的是MATLAB支持Latex啊,嘿嘿,这真是个好东西。先看下legend帮助文件里面怎么使用Latex的:
By default, MATLAB supports a subset of TeX markup. Use TeX markup to add superscripts and subscripts, modify the font type and color, and include special characters in the text.
the
Interpreterproperty set to'tex'.
就是我们需要改下legend的‘Interpreter ’属性就行了,如下:
legend({'$\tau_{1}$'},'Interpreter','latex');
啥,你的legend里面有多个标注,这样来:
legend({'$\tau_{1}$','$\tau_{2}$'},'Interpreter','latex');
怎么生成Latex代码?我的方法是现在公式编辑器里面打入需要的公式,然后用一个叫“Mathpix sniping tool ”的强大公式识别软件(用到就爱上了,再也离不开了),复制到上面的大括号里面就完事了。上结果:
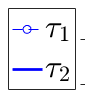
这个下标是不是美滋滋。


 2万+
2万+

 被折叠的 条评论
为什么被折叠?
被折叠的 条评论
为什么被折叠?
 到【灌水乐园】发言


