


 自编码器通过压缩编码和解码过程实现图像去噪。在编码阶段,数据被压缩成低维向量,丢失部分信息但保留主要特征。解码时,主要信息被用于重构图像,有效去除人为添加的噪声。
编码器主要的两个应用:
- 去噪 data denoising
- 数据降维 dimensionality reduction for data visualization
此处主要讲去噪,编码器首先需要对数据进行压缩编码为低维向量,这个过程是有损压缩,会在编码的过程中损失一部分信息,但同时会保留数据的主要成份信息,恰好可以利用此原理將图像中的噪声过滤,只保留数据的主要信息,再借助解码过程还原图片信息。
代码测试:
from keras.datasets import mnist
import numpy as np
import matplotlib.pyplot as plt
from keras.layers import Conv2D,MaxPooling2D,Input,UpSampling2D
from keras.models import Model
from keras.callbacks import TensorBoard

(x_train, _), (x_test, _) = mnist.load_data()

x_train = x_train.astype('float32') / 255.
x_test = x_test.astype('float32') / 255.
x_train = np.reshape(x_train, (len(x_train), 28, 28, 1))  # adapt this if using `channels_first` image data format
x_test = np.reshape(x_test, (len(x_test), 28, 28, 1))  # adapt this if using `channels_first` image data format

noise_factor = 0.5
x_train_noisy = x_train + noise_factor * np.random.normal(loc=0.0, scale=1.0, size=x_train.shape)
x_test_noisy = x_test + noise_factor * np.random.normal(loc=0.0, scale=1.0, size=x_test.shape)

x_train_noisy = np.clip(x_train_noisy, 0., 1.)
x_test_noisy = np.clip(x_test_noisy, 0., 1.)

input_img = Input(shape=(28, 28, 1))  # adapt this if using `channels_first` image data format

x = Conv2D(32, (3, 3), activation='relu', padding='same')(input_img)
x = MaxPooling2D((2, 2), padding='same')(x)
x = Conv2D(32, (3, 3), activation='relu', padding='same')(x)
encoded = MaxPooling2D((2, 2), padding='same')(x)

# at this point the representation is (7, 7, 32)

x = Conv2D(32, (3, 3), activation='relu', padding='same')(encoded)
x = UpSampling2D((2, 2))(x)
x = Conv2D(32, (3, 3), activation='relu', padding='same')(x)
x = UpSampling2D((2, 2))(x)
decoded = Conv2D(1, (3, 3), activation='sigmoid', padding='same')(x)

autoencoder = Model(input_img, decoded)
autoencoder.compile(optimizer='adadelta', loss='binary_crossentropy')

autoencoder.fit(x_train_noisy, x_train,
                epochs=50,
                batch_size=128,
                shuffle=True,
                validation_data=(x_test_noisy, x_test),
                callbacks=[TensorBoard(log_dir='/tmp/tb', histogram_freq=0, write_graph=False)])

new_imgs=autoencoder.predict(x_test_noisy[0:10])
n = 10
plt.figure(figsize=(20, 4))
for i in range(n):
    ax = plt.subplot(2, n, i+1)
    plt.imshow(x_test_noisy[i].reshape(28, 28))
    plt.gray()
    ax.get_xaxis().set_visible(False)
    ax.get_yaxis().set_visible(False)
    ax = plt.subplot(2, n, i+n+1)
    plt.imshow(new_imgs[i].reshape(28, 28))
    plt.gray()
    ax.get_xaxis().set_visible(False)
    ax.get_yaxis().set_visible(False)
plt.show()
结果如下:
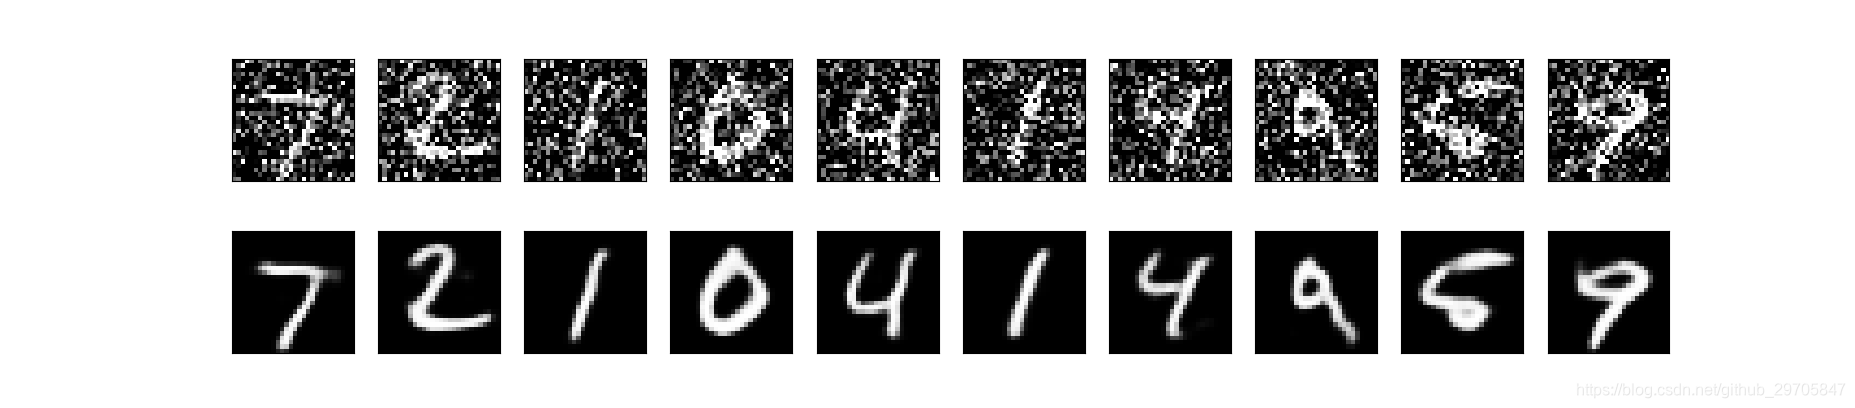
可以发现人为添加的噪声被去除。。。


 1202
1202

 被折叠的 条评论
为什么被折叠?
被折叠的 条评论
为什么被折叠?
 到【灌水乐园】发言


