


【Actuator】基于SpringBoot3.3.x版本④可观测性增强
摘要
可观测性由CNCF组织提出,在云原生中提到一个词Observerbility,随着云原生的崛起,可观测性成了云原生时代的必备能力。加上谷歌、阿里、腾讯等互联网大厂的参与,可观测性逐渐从幕后走进寻常百姓家。
那么,什么叫可观测性呢?用相对严谨的话来说,可观测性指的是一种能力,是通过检查其输出来衡量系统内部状态的能⼒。这些输出体现内部系统状态的能力越强,可观测性也就越好。
由此可以看出,可观测性的核心价值就是排查故障。搞IT的都知道,这个世界上不存在没有Bug的系统,无论软件架构设计的多么合理,代码质量多么高,只是降低出现问题的概率或者是提高解决问题的效率,系统的运维显得越来越重要,尤其是微服务分布式架构的时代,系统的复杂度越来越高,那么可观测性就是运维的重中之重了。
可观测性涉及最重要的三个概念,分别是日志、指标和链路追踪。那么,我们依然本着"最新"的原则,带着大家一起学习Spring Boot体系的可观测性。
本地开发环境说明
开发用到的主要框架、工具版本如下
| 开发依赖 | 版本 |
|---|---|
| Spring Boot | 3.3.4 |
| Spring Actuator | 3.3.4 |
| micrometer | 1.13.4 |
| JDK | 21 |
| IntelliJ IDEA | 2024.2.3 |
先快速完整一个微服务的搭建
pom.xml依赖
核心内容如下
<?xml version="1.0" encoding="UTF-8"?>
<project xmlns="http://maven.apache.org/POM/4.0.0"
         xmlns:xsi="http://www.w3.org/2001/XMLSchema-instance"
         xsi:schemaLocation="http://maven.apache.org/POM/4.0.0 http://maven.apache.org/xsd/maven-4.0.0.xsd">

    <parent>
        <groupId>org.springframework.boot</groupId>
        <artifactId>spring-boot-starter-parent</artifactId>
        <version>3.3.4</version>
        <relativePath/>
    </parent>
    <modelVersion>4.0.0</modelVersion>

    <groupId>com.wen3.framework-demo</groupId>
    <artifactId>wen3-framework-actuator-demo</artifactId>
    <version>1.0.0-SNAPSHOT</version>

    <dependencies>
        <dependency>
            <groupId>org.springframework.boot</groupId>
            <artifactId>spring-boot-starter-web</artifactId>
        </dependency>
    </dependencies>
</project>
启动类
package com.wen3.actuator.demo;


import org.springframework.boot.SpringApplication;
import org.springframework.boot.autoconfigure.SpringBootApplication;

/**
 * @author: tangheng
 */
@SpringBootApplication
public class ActuatorDemoApplication {

    public static void main(String[] args) {
        SpringApplication.run(ActuatorDemoApplication.class, args);
    }
}
修改tomcat默认端口
server:
  port: 8080
这样就完成了一个最简单的Spring Boot 3.3.4版本的微服务搭建,接下来我们一点点增加内容
自定义健康监控的端点
- 继承
AbstractHealthIndicator类
package com.wen3.actuator.demo.health;


import org.springframework.boot.actuate.health.AbstractHealthIndicator;
import org.springframework.boot.actuate.health.Health;

/**
 * @author: tangheng
 */
public class DemoHealthIndicator extends AbstractHealthIndicator {

    @Override
    protected void doHealthCheck(Health.Builder builder) throws Exception {
        //自定义检查方法
        //存活
        builder.up()
                .withDetail("code","200")
                .withDetail("msg","健康的运行")
                .build();

//        builder.down()
//                .withDetail("code","400")
//                .withDetail("msg","运行崩溃了")
//                .build();
    }
}
- 创建Bean
package com.wen3.actuator.demo.autoconfigure;


import com.wen3.actuator.demo.Service.ActuatorDemoService;
import com.wen3.actuator.demo.health.DemoHealthIndicator;
import org.springframework.boot.autoconfigure.condition.ConditionalOnMissingBean;
import org.springframework.context.annotation.Bean;

/**
 * @author: tangheng
 */
public class ActuatorDemoAutoConfiguration {

    @ConditionalOnMissingBean
    @Bean
    DemoHealthIndicator demoHealthIndicator() {
        return new DemoHealthIndicator();
    }
}
- 浏览器访问:
http://localhost:8080/actuator/health/demo
{"status":"UP","details":{"code":"200","msg":"健康的运行"}}
- 健康监控端点的名称默认是
Bean的名称,如果Bean名称是以HealthIndicator结尾,则名称会自动去掉HealthIndicator部分。
集成prometheus
- 增加pom依赖
<dependency>
    <groupId>io.micrometer</groupId>
    <artifactId>micrometer-registry-prometheus</artifactId>
</dependency>
- 浏览器访问:
http://localhost:8080/actuator/prometheus
# HELP application_ready_time_seconds Time taken for the application to be ready to service requests
# TYPE application_ready_time_seconds gauge
application_ready_time_seconds{main_application_class="com.wen3.actuator.demo.ActuatorDemoApplication"} 2.516
# HELP application_started_time_seconds Time taken to start the application
# TYPE application_started_time_seconds gauge
application_started_time_seconds{main_application_class="com.wen3.actuator.demo.ActuatorDemoApplication"} 2.432
# HELP custom_metric_demo_total
# TYPE custom_metric_demo_total counter
custom_metric_demo_total{name="2"} 2.0
custom_metric_demo_total{name="3"} 1.0
# HELP custom_metric_demo_no_tag_total
# TYPE custom_metric_demo_no_tag_total counter
custom_metric_demo_no_tag_total 3.0
使用Micrometer注解
- 想要让Micrometer注解生效,需要加入如下依赖
<dependency>
    <groupId>org.springframework.boot</groupId>
    <artifactId>spring-boot-starter-aop</artifactId>
</dependency>
- 使用注解
package com.wen3.actuator.demo.Service;


import io.micrometer.core.annotation.Counted;
import io.micrometer.observation.annotation.Observed;

/**
 * @author: tangheng
 */
public class ActuatorDemoService {

    @Observed(name = "hello.test", lowCardinalityKeyValues = {"username", "actuator-demo"})
    public String hello() {
        return "hello";
    }
}
- 查看端点数据:
http://localhost:8080/actuator/prometheus
# HELP hello_test_active_seconds
# TYPE hello_test_active_seconds summary
hello_test_active_seconds_count{class="com.wen3.actuator.demo.Service.ActuatorDemoService",method="hello",username="actuator-demo"} 0
hello_test_active_seconds_sum{class="com.wen3.actuator.demo.Service.ActuatorDemoService",method="hello",username="actuator-demo"} 0.0
# HELP hello_test_active_seconds_max
# TYPE hello_test_active_seconds_max gauge
hello_test_active_seconds_max{class="com.wen3.actuator.demo.Service.ActuatorDemoService",method="hello",username="actuator-demo"} 0.0
# HELP hello_test_seconds
# TYPE hello_test_seconds summary
hello_test_seconds_count{class="com.wen3.actuator.demo.Service.ActuatorDemoService",error="none",method="hello",username="actuator-demo"} 2
hello_test_seconds_sum{class="com.wen3.actuator.demo.Service.ActuatorDemoService",error="none",method="hello",username="actuator-demo"} 0.0031381
# HELP hello_test_seconds_max
# TYPE hello_test_seconds_max gauge
hello_test_seconds_max{class="com.wen3.actuator.demo.Service.ActuatorDemoService",error="none",method="hello",username="actuator-demo"} 0.0030121
Controller
先在浏览器请求几次接口后,再查看指标数据: http://localhost:8080/hello
package com.wen3.actuator.demo.controller;


import com.wen3.actuator.demo.Service.ActuatorDemoService;
import io.micrometer.core.instrument.Counter;
import io.micrometer.core.instrument.MeterRegistry;
import jakarta.annotation.PostConstruct;
import jakarta.annotation.Resource;
import lombok.AccessLevel;
import lombok.Setter;
import lombok.experimental.FieldDefaults;
import org.springframework.web.bind.annotation.GetMapping;
import org.springframework.web.bind.annotation.RestController;

/**
 * @author: tangheng
 */
@FieldDefaults(level = AccessLevel.PRIVATE)
@RestController
public class ActuatorDemoController {

    private Counter counter;

    @Setter(onMethod_ = @Resource)
    MeterRegistry meterRegistry;
    @Setter(onMethod_ = @Resource)
    ActuatorDemoService actuatorDemoService;

    @PostConstruct
    public void init() {
        counter = meterRegistry.counter("custom.metric.demo.no_tag");
    }

    @GetMapping("/hello")
    public String hello(String name) {
//        Counter counter = meterRegistry.counter("custom.metric.demo", name);
        Counter counter = meterRegistry.counter("custom.metric.demo","name",name);
        counter.increment();
        this.counter.increment();
        actuatorDemoService.hello();
        return "hello, " + name;
    }
}
运行Prometheus
prometheus-2.55.0-rc.1.windows-amd64下载地址:https://github.com/prometheus/prometheus/releases/download/v2.55.0-rc.1/prometheus-2.55.0-rc.1.windows-amd64.zip- 解压后进入目录运行
premetheus.exe,访问端口9090即可 - 修改
prometheus.yml, 在scrape_configs下增加
  ###以下内容为SpringBoot应用配置###
  # job_name对应springboot中的management.metrics.tags.application
  - job_name: 'prometheus-demo'
    # Override the global default and scrape targets from this job every 5 seconds.
    scrape_interval: 5s
    metrics_path: '/actuator/prometheus'
    static_configs:
      - targets: ['localhost:8080']
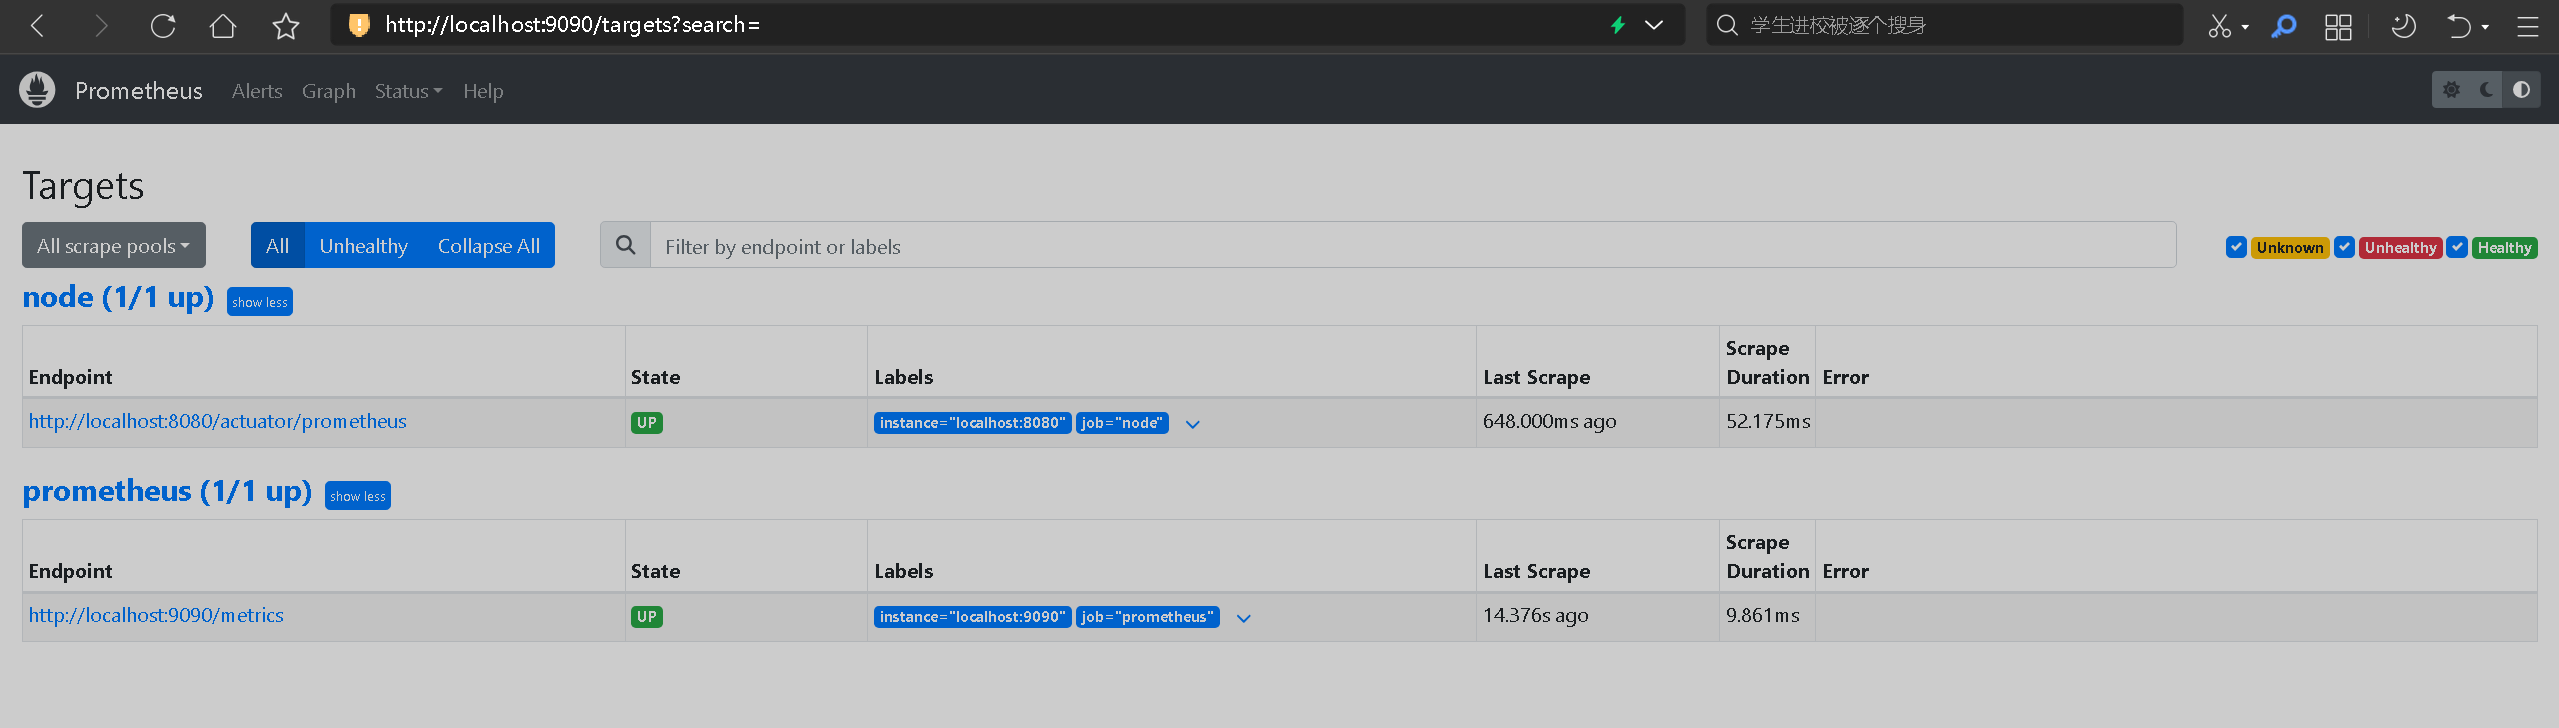
- 重启
prometheus,在菜单status>targets可以看到targets列表增加的项目,状态为up表示正常监控,状态为down表示未检测到
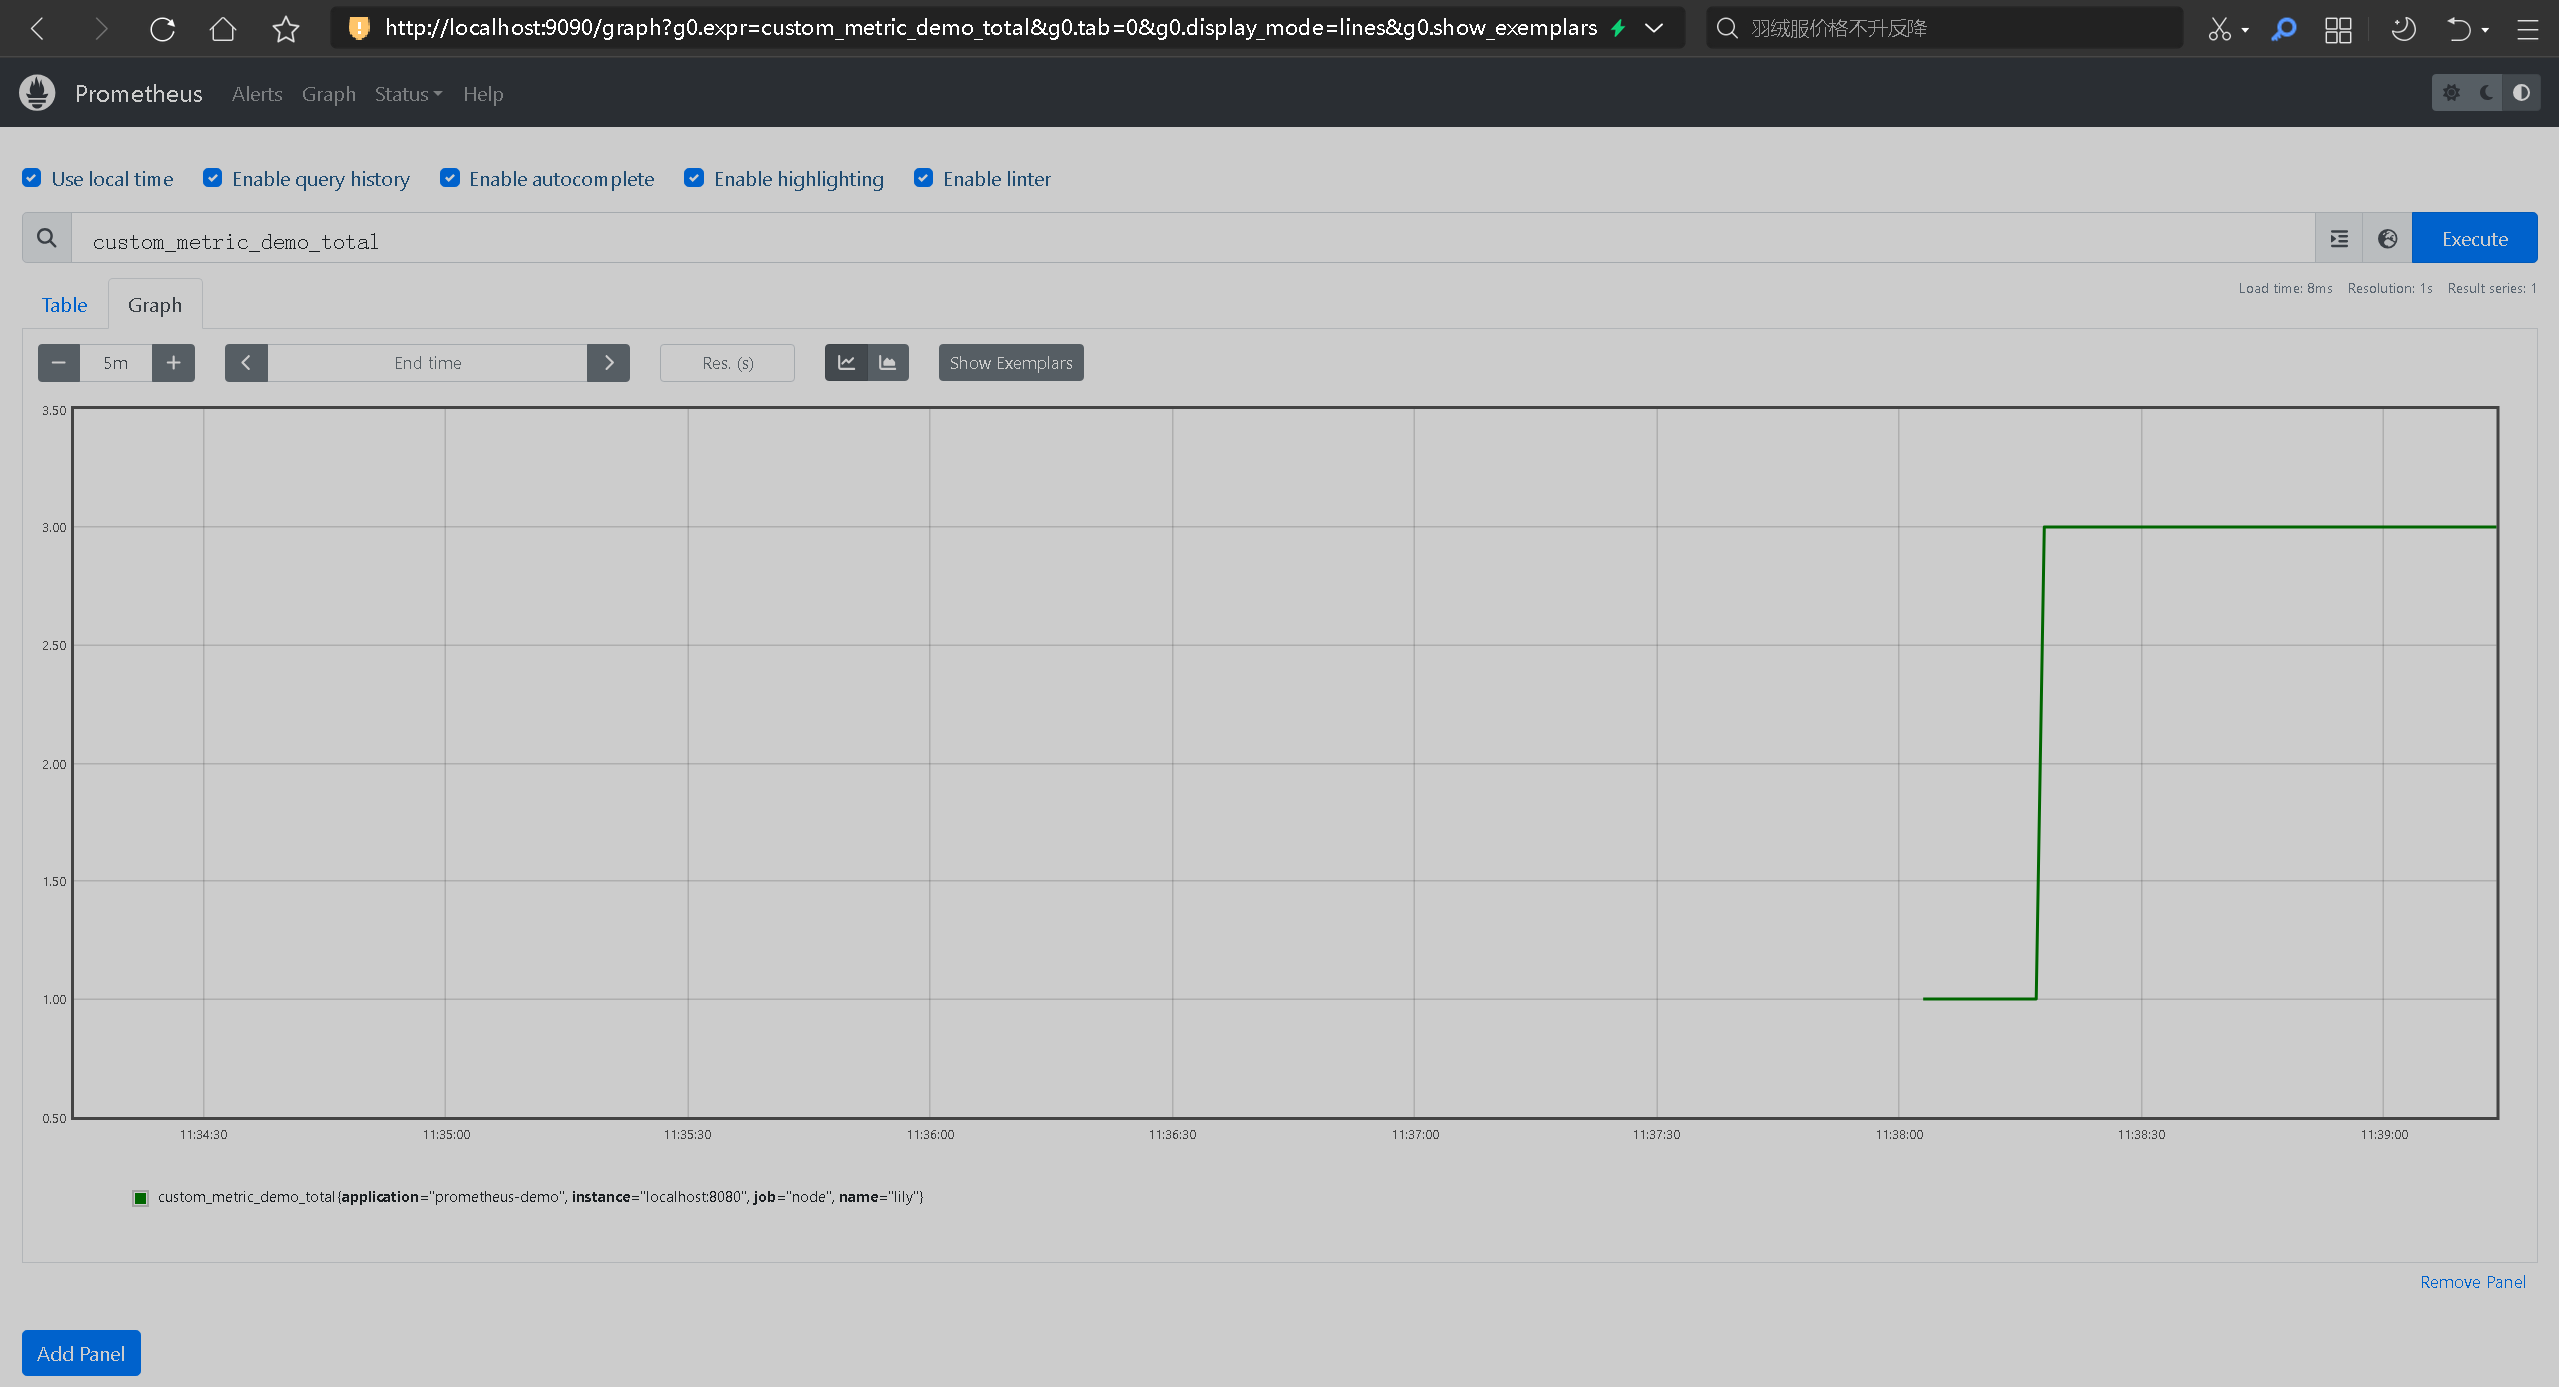
- 查看采集的指标
总结
- 本文演示了如何使用
Spring Boot微服务体系中开发自定义的业务指标,可以纯代码开发,也可以使用注解的方式。 - 演示了
Spring Boot与Prometheus如何集成,在可观测性领域,Prometheus也是最常用的工具之一。 - 还有
Grafana等可视化工具,可以结合Prometheus使用,以可视化的方式展示监控数据。


 1016
1016

 被折叠的 条评论
为什么被折叠?
被折叠的 条评论
为什么被折叠?
 到【灌水乐园】发言


