{
    dataset: {
      source: [
        ['date', '实时水位', '实时流量', '实时降雨量', '预报水位', '预报流量', '预报降雨量'],
        ['2021-03-01', 19.2, 3.0, 0.7, null, null, null],
        ['2021-03-02', 20.7, 3.1, 1.0, null, null, null],
        ['2021-03-03', 21.4, 3.3, 2.2, null, null, null],
        ['2021-03-04', 22.2, 3.5, 2.6, null, null, null],
        ['2021-03-05', 21.5, 4.0, 1.8, null, null, null],
        ['2021-03-06', 19.7, 3.4, 1.2, null, null, null],
        ['2021-03-07', 19.5, 3.0, 0.6, null, null, null],
        ['2021-03-08', 19.3, 3.1, 0.4, null, null, null],
        ['2021-03-09', 18.8, 2.9, 0.2, null, null, null],
        ['2021-03-10', 19.2, 3.0, 0.7, null, null, null],
        ['2021-03-11', 22.7, 3.3, 1.0, null, null, null],
        ['2021-03-12', 21.4, 3.5, 2.2, null, null, null],
        ['2021-03-13', 22.2, 3.9, 2.6, null, null, null],
        ['2021-03-14', 21.5, 4.2, 1.8, null, null, null],
        ['2021-03-15', 19.7, 3.4, 1.2, null, null, null],
        ['2021-03-16', 19.5, 3.3, 0.6, null, null, null],
        ['2021-03-17', 19.3, 3.0, 0.4, null, null, null],
        ['2021-03-18', 18.8, 2.9, 0.2, null, null, null],
        ['2021-03-19', 19.2, 3.0, 0.7, null, null, null],
        ['2021-03-20', 20.7, 3.3, 1.0, null, null, null],
        ['2021-03-21', 21.4, 3.5, 2.2, null, null, null],
        ['2021-03-22', 21.4, 3.8, 2.1, null, null, null],
        ['2021-03-23', 21.4, 3.1, 2.0, null, null, null],
        ['2021-03-24', 22.2, 3.9, 2.5, null, null, null],
        ['2021-03-25', 21.5, 4.2, 1.8, null, null, null],
        ['2021-03-26', 19.7, 3.4, 1.2, null, null, null],
        ['2021-03-27', 19.5, 3.0, 0.6, null, null, null],
        ['2021-03-28', 19.3, 3.0, 0.4, null, null, null],
        ['2021-03-29', 18.8, 2.9, 0.2, null, null, null],
        ['2021-03-30', 19.5, 3.0, 0.6, null, null, null],
        ['2021-03-31', 19.5, 3.0, 0.3, null, null, null],
        ['2021-04-01', 19.3, 3.0, null, 19.3, 3.0, 0.4],
        ['2021-04-02', null, null, null, 18.8, 2.9, 0.2],
        ['2021-04-03', null, null, null, 19.2, 3.0, 0.7],
        ['2021-04-04', null, null, null, 22.7, 3.3, 1.0],
        ['2021-04-05', null, null, null, 21.4, 3.5, 2.2],
        ['2021-04-06', null, null, null, 22.2, 3.9, 2.6],
        ['2021-04-07', null, null, null, 21.5, 4.2, 1.8],
        ['2021-04-08', null, null, null, 19.7, 3.4, 1.2],
        ['2021-04-09', null, null, null, 19.5, 3.0, 0.6],
        ['2021-04-10', null, null, null, 19.3, 3.0, 0.4],
        ['2021-04-11', null, null, null, 18.8, 2.9, 0.2],
        ['2021-04-12', null, null, null, 19.2, 3.0, 0.7],
        ['2021-04-13', null, null, null, 20.7, 3.3, 1.0],
        ['2021-04-14', null, null, null, 21.4, 3.5, 2.2],
        ['2021-04-15', null, null, null, 21.4, 3.8, 2.0],
        ['2021-04-16', null, null, null, 21.4, 3.1, 2.0]
      ]
    },
    tooltip: {
      trigger: 'axis'
    },
    axisPointer: {
      triggerTooltip: true,
      link: {
        xAxisIndex: 'all'
      }
    },
    dataZoom: [
      {
        type: 'inside',
        xAxisIndex: [0, 1],
        minSpan: 12
      },
      {
        show: true,
        xAxisIndex: [0, 1],
        type: 'slider',
        top: '88%',
        minSpan: 12
      }
    ],
    grid: [
      {
        top: '30%',
        left: '8%',
        right: '8%',
        height: '50%'
      },
      {
        top: '10%',
        left: '8%',
        right: '8%',
        height: '20%'
      }
    ],
    xAxis: [
      {
        type: 'category',
        gridIndex: 0,
        boundaryGap: false
      },
      {
        type: 'category',
        gridIndex: 1,
        boundaryGap: false,
        show: false
      }
    ],
    yAxis: [
      {
        type: 'value',
        name: '水位(m)',
        splitNumber: 5,
        gridIndex: 0,
        nameTextStyle: {
          padding: 15
        },
        axisLine: {
          lineStyle: {
            color: '#5780fa'
          }
        },
        nameLocation: 'center',
        min: function(value) {
          return (value.min - value.min * 0.2).toFixed()
        },
        max: function(value) {
          return (value.max - value.max * 0.2).toFixed()
        }
      },
      {
        type: 'value',
        name: '流量(m³/s)',
        splitNumber: 5,
        gridIndex: 0,
        nameTextStyle: {
          padding: 15
        },
        axisLine: {
          lineStyle: {
            color: '#ff975f'
          }
        },

        position: 'right',
        nameLocation: 'center',
        min: function(value) {
          return (value.min - value.min * 0.2).toFixed()
        },
        max: function(value) {
          return (value.max + value.max * 0.2).toFixed()
        }
      },
      {
        type: 'value',
        name: '降雨量(mm)',
        gridIndex: 1,
        nameTextStyle: {
          padding: 15
        },
        axisLine: {
          lineStyle: {
            color: '#68C31E'
          }
        },
        nameLocation: 'center',
        inverse: true,
        axisLabel: {
          showMaxLabel: false
        },
        minInterval: 0.5,

        min: function(value) {
          return (value.min - value.min * 0.2).toFixed()
        },
        max: function(value) {
          return (value.max + value.max * 0.2).toFixed()
        }
      }
    ],
    legend: {
      data: ['实时水位', '实时流量', '实时降雨量', '预报水位', '预报流量', '预报降雨量'],
      type: 'scroll'
    },

    series: [
      {
        name: '实时水位',
        type: 'line',
        symbol: 'none',
        lineStyle: {
          color: '#5780fa'
        },
        itemStyle: {
          color: '#5780fa'
        },
        markLine: {
          symbol: 'none',
          lineStyle: {
            type: 'dotted'
          },
          data: [
            {
              name: '预报时间',
              label: {
                show: true,
                position: 'end',
                formatter: '{b}: {c}'
              },
              xAxis: '2021-04-01'
            }
          ]
        }
      },
      {
        name: '实时流量',
        type: 'line',
        yAxisIndex: 1,
        symbol: 'none',
        lineStyle: {
          color: '#ff975f'
        },
        itemStyle: {
          color: '#ff975f'
        }
      },
      {
        name: '实时降雨量',
        type: 'bar',
        barWidth: '10px',
        stack: '堆叠',
        xAxisIndex: 1,
        yAxisIndex: 2,
        lineStyle: {
          color: '#68C31E'
        },
        itemStyle: {
          color: '#68C31E'
        },
        markLine: {
          symbol: 'none',
          lineStyle: {
            type: 'dotted'
          },
          data: [
            {
              name: '预报时间',
              label: {
                // show: true,
                show: false,
                position: 'end',
                formatter: '{b}: {c}'
              },
              xAxis: '2021-04-01'
            }
          ]
        }
      },
      {
        name: '预报水位',
        type: 'line',
        symbol: 'none',
        lineStyle: {
          color: '#5780fa',
          type: 'dotted'
        },
        itemStyle: {
          color: '#5780fa'
        }
      },
      {
        name: '预报流量',
        type: 'line',
        yAxisIndex: 1,
        symbol: 'none',
        lineStyle: {
          color: '#ff975f',
          type: 'dotted'
        },
        itemStyle: {
          color: '#ff975f'
        }
      },
      {
        name: '预报降雨量',
        type: 'bar',
        barWidth: '10px',
        stack: '堆叠',
        xAxisIndex: 1,
        yAxisIndex: 2,
        lineStyle: {
          color: '#68C31E'
        },
        itemStyle: {
          color: '#68C31E'
        }
      }
    ]
  }


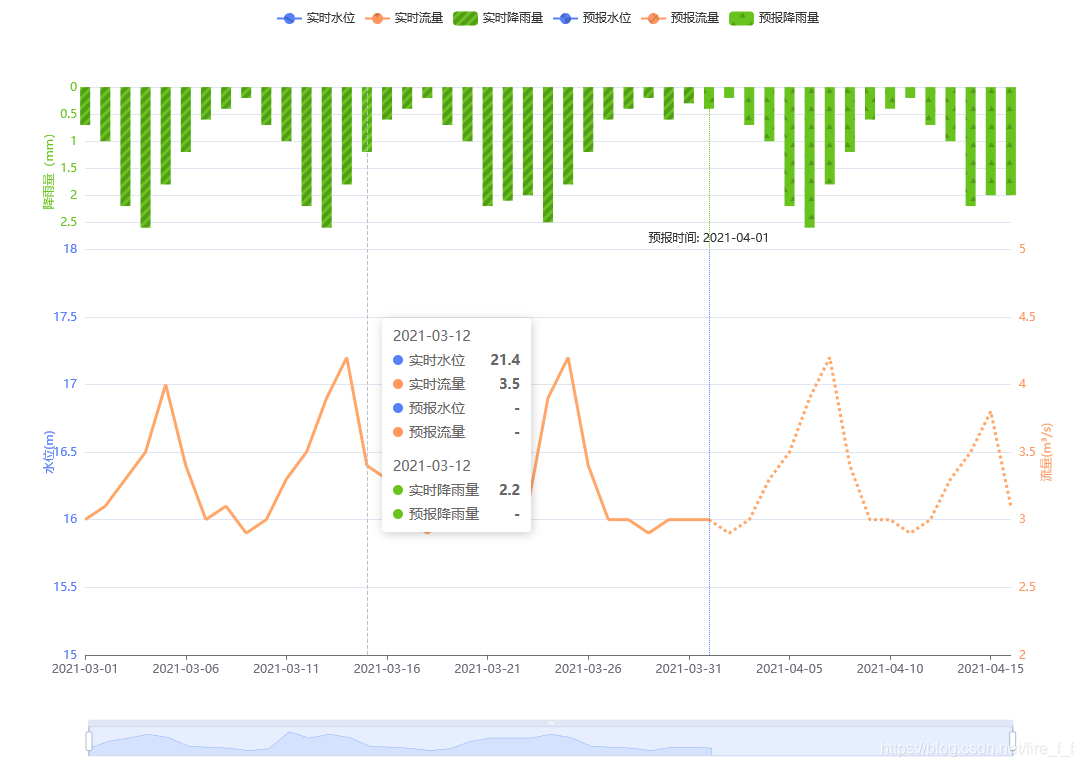
 本文介绍了如何利用Echarts库在Vue.js项目中创建展示水位、流量和降雨量的多轴图表。通过实例代码详细讲解了配置项设置和数据绑定,帮助开发者实现复杂数据的可视化呈现。


 1600
1600

 被折叠的 条评论
为什么被折叠?
被折叠的 条评论
为什么被折叠?
 到【灌水乐园】发言


