


摘要
本文将详细介绍如何使用Prometheus监控RAGFlow(Retrieval-Augmented Generation Flow)系统。RAGFlow是一种结合了检索和生成的AI应用架构,广泛应用于自然语言处理(NLP)和机器学习(ML)领域。通过Prometheus监控,您可以实时了解系统的运行状态,及时发现并解决性能问题。本文将从基础概念入手,逐步深入到实际配置和监控实践,适合中国开发者,特别是AI应用开发者阅读。文章包含完整的代码示例、架构图、流程图、思维导图、甘特图和饼图等,以增强可读性和实用性。
正文
1. 引言
在AI应用开发中,监控系统的运行状态是确保应用稳定性和性能的关键。随着大语言模型(LLM)和检索增强生成(RAG)技术的快速发展,越来越多的企业开始构建基于RAGFlow的AI应用。然而,这些复杂的AI系统在运行过程中会产生大量的指标数据,如何有效监控这些指标成为了一个重要课题。
Prometheus作为一个开源的监控系统,能够实时收集和存储监控数据,并通过强大的查询语言PromQL提供灵活的查询功能。它广泛应用于监控各种系统和应用,包括Kubernetes、Docker等。本文将详细介绍如何使用Prometheus监控RAGFlow系统,帮助您从零开始,逐步掌握监控实践。
2. RAGFlow简介
2.1 什么是RAGFlow
RAGFlow(Retrieval-Augmented Generation Flow)是一种结合了检索和生成的AI应用架构。它通过检索模块从大规模数据中提取相关信息,然后通过生成模块生成最终的输出。这种架构在处理复杂任务时表现出色,能够有效提高系统的效率和准确性。
RAGFlow的核心组件包括:
- 文档解析模块:处理各种格式的文档,如PDF、Word、PPT等
- 向量存储模块:存储文档的向量表示,支持快速检索
- 检索模块:根据用户查询从向量存储中检索相关文档
- 生成模块:结合检索结果和用户查询生成最终回答
- API接口模块:提供对外服务接口
2.2 RAGFlow的应用场景
RAGFlow广泛应用于以下场景:
- 智能客服系统:基于企业知识库提供自动问答服务
- 文档分析系统:自动分析和总结复杂文档内容
- 智能助手:为用户提供个性化的信息查询服务
- 法律咨询系统:基于法律条文和案例提供咨询服务
3. Prometheus简介
3.1 Prometheus是什么
Prometheus是一个开源的系统监控和告警工具包,最初由SoundCloud开发,后来成为Cloud Native Computing Foundation(CNCF)的一部分。它通过HTTP协议抓取被监控系统的指标数据,并将这些数据存储在时间序列数据库中。
Prometheus的主要特点包括:
- 多维数据模型:使用标签(labels)来标识时间序列
- Pull模式:主动从目标系统拉取指标数据
- 服务发现:支持多种服务发现机制
- 强大的查询语言:PromQL支持复杂的数据查询和分析
- 不依赖分布式存储:单个服务器节点是自治的
3.2 Prometheus架构
Prometheus的架构主要包括以下几个组件:
4. 监控RAGFlow的必要性
监控RAGFlow系统的运行状态对于确保系统的稳定性和性能至关重要。通过监控,您可以:
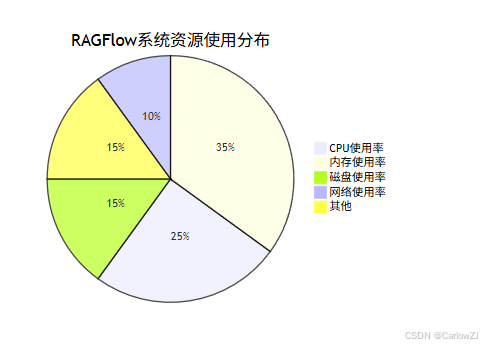
- 实时了解系统的运行状态:监控CPU、内存、磁盘等系统资源使用情况
- 及时发现并解决性能问题:通过响应时间、吞吐量等指标发现性能瓶颈
- 提高系统的可靠性和用户体验:通过错误率、成功率等指标确保服务质量
- 优化资源配置:根据实际使用情况调整硬件资源配置
- 支持故障排查:通过详细的指标数据快速定位问题原因
4.1 关键监控指标
监控RAGFlow系统时,需要关注以下关键指标:

mindmap
  root((RAGFlow监控指标))
    业务指标
      对话数
        总对话数
        每秒对话数
      消息数
        总消息数
        错误消息数
      工作流执行
        执行次数
        执行时间
        成功率
      Token使用量
        输入Token数
        输出Token数
        总Token数
    系统指标
      CPU使用率
        平均使用率
        最大使用率
      内存使用情况
        已使用内存
        内存使用率
      磁盘使用情况
        已使用空间
        磁盘IO
      网络使用情况
        网络流入
        网络流出
    性能指标
      响应时间
        P50响应时间
        P95响应时间
        P99响应时间
      吞吐量
        每秒请求数
        并发用户数
      错误率
        HTTP错误率
        业务错误率
5. Prometheus监控RAGFlow的步骤
5.1 安装Prometheus
首先,您需要安装Prometheus。可以通过以下几种方式安装Prometheus:
使用二进制文件安装
# 下载Prometheus
wget https://github.com/prometheus/prometheus/releases/download/v2.45.0/prometheus-2.45.0.linux-amd64.tar.gz

# 解压文件
tar xvfz prometheus-2.45.0.linux-amd64.tar.gz

# 进入目录
cd prometheus-2.45.0.linux-amd64
使用Docker安装
# 拉取Prometheus镜像
docker pull prom/prometheus

# 运行Prometheus容器
docker run -d \
  --name prometheus \
  -p 9090:9090 \
  -v /path/to/prometheus.yml:/etc/prometheus/prometheus.yml \
  prom/prometheus
5.2 配置Prometheus
编辑prometheus.yml文件,添加RAGFlow的监控配置:
# 全局配置
global:
  scrape_interval: 15s      # 默认抓取间隔
  evaluation_interval: 15s  # 规则评估间隔

# 告警规则文件
rule_files:
  - "ragflow_rules.yml"

# 告警管理器配置
alerting:
  alertmanagers:
    - static_configs:
        - targets:
          # - alertmanager:9093

# 抓取配置
scrape_configs:
  # Prometheus自身监控
  - job_name: 'prometheus'
    static_configs:
      - targets: ['localhost:9090']

  # RAGFlow监控
  - job_name: 'ragflow'
    metrics_path: '/metrics'
    static_configs:
      - targets: ['localhost:8080']  # 替换为RAGFlow的实际指标端点
        labels:
          service: 'ragflow-api'
          environment: 'production'

  # Node Exporter(系统级监控)
  - job_name: 'node'
    static_configs:
      - targets: ['localhost:9100']
        labels:
          service: 'node-exporter'
          environment: 'production'
5.3 在RAGFlow中集成Prometheus客户端
要在RAGFlow中暴露指标供Prometheus抓取,需要在RAGFlow应用中集成Prometheus客户端。以下是一个Python示例:
#!/usr/bin/env python3
# -*- coding: utf-8 -*-
"""
RAGFlow Prometheus监控集成示例
该模块展示了如何在RAGFlow应用中集成Prometheus客户端,
暴露关键业务和系统指标供监控系统抓取。
"""

import time
import logging
import threading
from typing import Dict, Any
import psutil
from prometheus_client import Counter, Histogram, Gauge, start_http_server

# 配置日志
logging.basicConfig(
    level=logging.INFO,
    format='%(asctime)s - %(name)s - %(levelname)s - %(message)s'
)
logger = logging.getLogger(__name__)


class RAGFlowMetricsCollector:
    """
    RAGFlow核心监控指标收集器
    负责收集业务指标和系统指标,并通过Prometheus暴露
    """

    def __init__(self):
        """初始化所有监控指标"""
        # 业务指标 - 对话相关
        self.app_conversations = Counter(
            'ragflow_app_conversations_total',
            'Total number of conversations processed',
            ['app_id', 'tenant_id']
        )

        # 业务指标 - 消息相关
        self.app_messages = Counter(
            'ragflow_app_messages_total',
            'Total number of messages processed',
            ['app_id', 'tenant_id', 'message_type']
        )

        # 业务指标 - 工作流执行相关
        self.workflow_executions = Counter(
            'ragflow_workflow_executions_total',
            'Total workflow executions',
            ['workflow_id', 'status']
        )

        # 业务指标 - 工作流执行时间
        self.workflow_duration = Histogram(
            'ragflow_workflow_duration_seconds',
            'Workflow execution duration in seconds',
            ['workflow_id', 'status'],
            buckets=[0.1, 0.5, 1.0, 2.5, 5.0, 10.0, 30.0, 60.0, 120.0]
        )

        # 业务指标 - Token使用量
        self.token_usage = Counter(
            'ragflow_token_usage_total',
            'Total token usage for LLM operations',
            ['model_provider', 'model_name', 'usage_type']
        )

        # 业务指标 - 活跃对话数
        self.active_conversations = Gauge(
            'ragflow_active_conversations',
            'Number of currently active conversations',
            ['app_id']
        )

        # 系统指标 - CPU使用率
        self.cpu_usage = Gauge(
            'system_cpu_usage_percent',
            'Current CPU usage percentage'
        )

        # 系统指标 - 内存使用情况
        self.memory_usage_bytes = Gauge(
            'system_memory_usage_bytes',
            'Current memory usage in bytes'
        )
        self.memory_usage_percent = Gauge(
            'system_memory_usage_percent',
            'Current memory usage percentage'
        )

        # 系统指标 - 磁盘使用情况
        self.disk_usage_bytes = Gauge(
            'system_disk_usage_bytes',
            'Current disk usage in bytes',
            ['path']
        )
        self.disk_usage_percent = Gauge(
            'system_disk_usage_percent',
            'Current disk usage percentage',
            ['path']
        )

        # 系统指标 - 网络流量
        self.network_bytes_sent = Gauge(
            'system_network_bytes_sent_total',
            'Total network bytes sent'
        )
        self.network_bytes_received = Gauge(
            'system_network_bytes_received_total',
            'Total network bytes received'
        )

        # 启动系统监控线程
        self._start_system_monitoring()

    def _start_system_monitoring(self):
        """
        启动后台线程,定期收集系统指标
        """
        def monitor_system_metrics():
            """系统指标收集函数"""
            while True:
                try:
                    # 收集CPU使用率
                    cpu_percent = psutil.cpu_percent(interval=1)
                    self.cpu_usage.set(cpu_percent)
                    logger.debug(f"CPU使用率: {cpu_percent}%")

                    # 收集内存使用情况
                    memory = psutil.virtual_memory()
                    self.memory_usage_bytes.set(memory.used)
                    self.memory_usage_percent.set(memory.percent)
                    logger.debug(f"内存使用: {memory.used} bytes ({memory.percent}%)")

                    # 收集磁盘使用情况
                    for disk_path in ['/', '/data']:
                        try:
                            disk_usage = psutil.disk_usage(disk_path)
                            self.disk_usage_bytes.labels(path=disk_path).set(disk_usage.used)
                            usage_percent = (disk_usage.used / disk_usage.total) * 100
                            self.disk_usage_percent.labels(path=disk_path).set(usage_percent)
                            logger.debug(f"磁盘 {disk_path} 使用: {disk_usage.used} bytes ({usage_percent}%)")
                        except FileNotFoundError:
                            # 某些路径可能不存在,跳过
                            logger.debug(f"磁盘路径 {disk_path} 不存在,跳过监控")
                            continue

                    # 收集网络流量
                    network = psutil.net_io_counters()
                    self.network_bytes_sent.set(network.bytes_sent)
                    self.network_bytes_received.set(network.bytes_recv)
                    logger.debug(f"网络流量 - 发送: {network.bytes_sent} bytes, 接收: {network.bytes_recv} bytes")

                except Exception as e:
                    logger.error(f"收集系统指标时发生错误: {e}")

                # 每30秒收集一次系统指标
                time.sleep(30)

        # 启动后台监控线程
        system_monitor_thread = threading.Thread(
            target=monitor_system_metrics,
            daemon=True,
            name="SystemMetricsMonitor"
        )
        system_monitor_thread.start()
        logger.info("系统指标监控线程已启动")

    def increment_conversation_count(self, app_id: str, tenant_id: str):
        """
        增加对话计数

        Args:
            app_id (str): 应用ID
            tenant_id (str): 租户ID
        """
        self.app_conversations.labels(app_id=app_id, tenant_id=tenant_id).inc()
        logger.info(f"对话计数增加 - App: {app_id}, Tenant: {tenant_id}")

    def increment_message_count(self, app_id: str, tenant_id: str, message_type: str):
        """
        增加消息计数

        Args:
            app_id (str): 应用ID
            tenant_id (str): 租户ID
            message_type (str): 消息类型 (如: user, assistant, error)
        """
        self.app_messages.labels(
            app_id=app_id,
            tenant_id=tenant_id,
            message_type=message_type
        ).inc()
        logger.info(f"消息计数增加 - App: {app_id}, Tenant: {tenant_id}, Type: {message_type}")

    def record_workflow_execution(self, workflow_id: str, status: str, duration: float):
        """
        记录工作流执行情况

        Args:
            workflow_id (str): 工作流ID
            status (str): 执行状态 (如: success, failed)
            duration (float): 执行时间(秒)
        """
        self.workflow_executions.labels(workflow_id=workflow_id, status=status).inc()
        self.workflow_duration.labels(workflow_id=workflow_id, status=status).observe(duration)
        logger.info(f"工作流执行记录 - Workflow: {workflow_id}, Status: {status}, Duration: {duration}s")

    def increment_token_usage(self, provider: str, model_name: str, usage_type: str, count: int):
        """
        增加Token使用量

        Args:
            provider (str): 模型提供商 (如: openai, anthropic)
            model_name (str): 模型名称
            usage_type (str): 使用类型 (如: input, output)
            count (int): Token数量
        """
        self.token_usage.labels(
            model_provider=provider,
            model_name=model_name,
            usage_type=usage_type
        ).inc(count)
        logger.info(f"Token使用量增加 - Provider: {provider}, Model: {model_name}, Type: {usage_type}, Count: {count}")

    def set_active_conversations(self, app_id: str, count: int):
        """
        设置活跃对话数

        Args:
            app_id (str): 应用ID
            count (int): 活跃对话数
        """
        self.active_conversations.labels(app_id=app_id).set(count)
        logger.info(f"活跃对话数设置 - App: {app_id}, Count: {count}")


# 全局指标收集器实例
metrics_collector = RAGFlowMetricsCollector()


def simulate_ragflow_operations():
    """
    模拟RAGFlow操作,用于演示指标收集
    """
    import random

    # 模拟对话处理
    app_ids = ['app_001', 'app_002', 'app_003']
    tenant_ids = ['tenant_a', 'tenant_b']
    message_types = ['user', 'assistant', 'error']
    workflow_ids = ['wf_001', 'wf_002']
    statuses = ['success', 'failed']
    providers = ['openai', 'anthropic']
    models = ['gpt-3.5-turbo', 'claude-2']
    usage_types = ['input', 'output']

    while True:
        try:
            # 随机选择参数
            app_id = random.choice(app_ids)
            tenant_id = random.choice(tenant_ids)
            message_type = random.choice(message_types)
            workflow_id = random.choice(workflow_ids)
            status = random.choice(statuses)
            provider = random.choice(providers)
            model = random.choice(models)
            usage_type = random.choice(usage_types)

            # 更新指标
            metrics_collector.increment_conversation_count(app_id, tenant_id)
            metrics_collector.increment_message_count(app_id, tenant_id, message_type)
            metrics_collector.record_workflow_execution(
                workflow_id,
                status,
                random.uniform(0.1, 10.0)
            )
            metrics_collector.increment_token_usage(
                provider,
                model,
                usage_type,
                random.randint(10, 1000)
            )
            metrics_collector.set_active_conversations(
                app_id,
                random.randint(0, 50)
            )

            # 随机休眠一段时间
            time.sleep(random.uniform(0.1, 2.0))

        except Exception as e:
            logger.error(f"模拟操作时发生错误: {e}")


if __name__ == "__main__":
    # 启动Prometheus指标服务器
    start_http_server(8000)
    logger.info("Prometheus指标服务器已在端口8000启动")

    # 启动模拟操作线程(仅用于演示)
    simulation_thread = threading.Thread(
        target=simulate_ragflow_operations,
        daemon=True,
        name="SimulationThread"
    )
    simulation_thread.start()
    logger.info("模拟操作线程已启动")

    # 主线程保持运行
    try:
        while True:
            time.sleep(1)
    except KeyboardInterrupt:
        logger.info("程序已退出")
5.4 启动Prometheus服务
启动Prometheus服务:
# 使用二进制文件启动
./prometheus --config.file=./prometheus.yml --storage.tsdb.path=./data

# 或使用Docker启动
docker run -d \
  --name prometheus \
  -p 9090:9090 \
  -v $(pwd)/prometheus.yml:/etc/prometheus/prometheus.yml \
  prom/prometheus
5.5 验证监控数据
访问Prometheus的Web界面(通常是http://localhost:9090),并在查询界面中输入RAGFlow的指标名称,如ragflow_app_conversations_total,检查是否能够返回数据。
6. 配置Grafana进行数据可视化
6.1 安装Grafana
# 使用Docker安装Grafana
docker run -d \
  --name grafana \
  -p 3000:3000 \
  grafana/grafana-enterprise
6.2 配置Prometheus数据源
- 打开Grafana界面(
http://localhost:3000) - 使用默认用户名/密码登录(admin/admin)
- 进入"Configuration" -> “Data Sources”
- 点击"Add data source"
- 选择"Prometheus"
- 配置URL为Prometheus服务地址(如:
http://prometheus:9090) - 点击"Save & Test"
6.3 创建Dashboard
创建一个Grafana Dashboard来可视化RAGFlow的关键指标:
{
  "dashboard": {
    "id": null,
    "title": "RAGFlow监控面板",
    "timezone": "browser",
    "schemaVersion": 16,
    "version": 0,
    "refresh": "5s",
    "panels": [
      {
        "type": "graph",
        "title": "系统CPU使用率",
        "gridPos": {
          "x": 0,
          "y": 0,
          "w": 12,
          "h": 8
        },
        "targets": [
          {
            "expr": "system_cpu_usage_percent",
            "legendFormat": "CPU使用率",
            "refId": "A"
          }
        ],
        "datasource": "Prometheus"
      },
      {
        "type": "graph",
        "title": "系统内存使用情况",
        "gridPos": {
          "x": 12,
          "y": 0,
          "w": 12,
          "h": 8
        },
        "targets": [
          {
            "expr": "system_memory_usage_percent",
            "legendFormat": "内存使用率",
            "refId": "A"
          }
        ],
        "datasource": "Prometheus"
      },
      {
        "type": "stat",
        "title": "活跃对话数",
        "gridPos": {
          "x": 0,
          "y": 8,
          "w": 8,
          "h": 6
        },
        "targets": [
          {
            "expr": "ragflow_active_conversations",
            "legendFormat": "{{app_id}}",
            "refId": "A"
          }
        ],
        "datasource": "Prometheus"
      },
      {
        "type": "graph",
        "title": "工作流执行时间(P95)",
        "gridPos": {
          "x": 8,
          "y": 8,
          "w": 16,
          "h": 6
        },
        "targets": [
          {
            "expr": "histogram_quantile(0.95, sum(rate(ragflow_workflow_duration_seconds_bucket[5m])) by (le))",
            "legendFormat": "P95执行时间",
            "refId": "A"
          }
        ],
        "datasource": "Prometheus"
      },
      {
        "type": "graph",
        "title": "Token使用量",
        "gridPos": {
          "x": 0,
          "y": 14,
          "w": 24,
          "h": 8
        },
        "targets": [
          {
            "expr": "rate(ragflow_token_usage_total[5m])",
            "legendFormat": "{{model_provider}}-{{model_name}}-{{usage_type}}",
            "refId": "A"
          }
        ],
        "datasource": "Prometheus"
      }
    ]
  }
}
7. 配置告警规则
7.1 创建告警规则文件
创建一个告警规则文件ragflow_rules.yml:
groups:
  - name: ragflow.rules
    rules:
      # 业务相关告警
      - alert: HighErrorRate
        expr: rate(ragflow_app_messages_total{message_type="error"}[5m]) / rate(ragflow_app_messages_total[5m]) > 0.05
        for: 1m
        labels:
          severity: warning
        annotations:
          summary: "High error rate detected"
          description: "Error rate is above 5% for more than 1 minute"

      - alert: HighWorkflowFailureRate
        expr: rate(ragflow_workflow_executions_total{status="failed"}[5m]) / rate(ragflow_workflow_executions_total[5m]) > 0.1
        for: 1m
        labels:
          severity: critical
        annotations:
          summary: "High workflow failure rate"
          description: "More than 10% of workflows are failing"

      - alert: HighLatency
        expr: histogram_quantile(0.99, rate(ragflow_workflow_duration_seconds_bucket[5m])) > 10
        for: 1m
        labels:
          severity: warning
        annotations:
          summary: "High latency detected"
          description: "99th percentile latency is above 10 seconds"

      # 系统相关告警
      - alert: HighCPUUsage
        expr: system_cpu_usage_percent > 80
        for: 2m
        labels:
          severity: warning
        annotations:
          summary: "High CPU usage"
          description: "CPU usage has been above 80% for more than 2 minutes"

      - alert: HighMemoryUsage
        expr: system_memory_usage_percent > 85
        for: 2m
        labels:
          severity: warning
        annotations:
          summary: "High memory usage"
          description: "Memory usage has been above 85% for more than 2 minutes"

      - alert: LowDiskSpace
        expr: system_disk_usage_percent > 90
        for: 1m
        labels:
          severity: critical
        annotations:
          summary: "Low disk space"
          description: "Disk usage is above 90%"

      - alert: HighNetworkTraffic
        expr: rate(system_network_bytes_sent_total[5m]) > 100000000
        for: 1m
        labels:
          severity: warning
        annotations:
          summary: "High network traffic"
          description: "Network traffic is above 100MB/s"
7.2 配置Alertmanager
创建Alertmanager配置文件alertmanager.yml:
global:
  smtp_smarthost: 'localhost:25'
  smtp_from: 'alertmanager@example.org'
  smtp_require_tls: false

route:
  group_by: ['alertname']
  group_wait: 10s
  group_interval: 10s
  repeat_interval: 1h
  receiver: 'webhook'

receivers:
  - name: 'webhook'
    webhook_configs:
      - url: 'http://localhost:5001/webhook'
8. 实践案例
8.1 实际应用场景
假设您正在开发一个基于RAGFlow的智能客服系统,需要监控系统的性能指标,如API请求延迟、任务队列积压数等。
8.2 实施步骤
以下是一个完整的实施计划:
8.3 完整示例代码
以下是一个完整的RAGFlow应用示例,包含Prometheus监控集成:
#!/usr/bin/env python3
# -*- coding: utf-8 -*-
"""
RAGFlow完整应用示例
包含Prometheus监控集成、API接口和业务逻辑
"""

import time
import json
import logging
import threading
from typing import Dict, Any
from flask import Flask, request, jsonify
from prometheus_client import Counter, Histogram, Gauge, start_http_server, generate_latest

# 配置日志
logging.basicConfig(
    level=logging.INFO,
    format='%(asctime)s - %(name)s - %(levelname)s - %(message)s'
)
logger = logging.getLogger(__name__)

# 初始化Flask应用
app = Flask(__name__)

# 初始化监控指标
# HTTP请求相关指标
http_requests_total = Counter(
    'http_requests_total',
    'Total HTTP requests',
    ['method', 'endpoint', 'status']
)

http_request_duration_seconds = Histogram(
    'http_request_duration_seconds',
    'HTTP request duration in seconds',
    ['method', 'endpoint']
)

# 业务相关指标
conversations_total = Counter(
    'ragflow_conversations_total',
    'Total number of conversations',
    ['app_id']
)

messages_total = Counter(
    'ragflow_messages_total',
    'Total number of messages',
    ['app_id', 'message_type']
)

active_conversations = Gauge(
    'ragflow_active_conversations',
    'Number of active conversations',
    ['app_id']
)

# 模拟RAGFlow核心处理逻辑
class RAGFlowProcessor:
    """RAGFlow核心处理器"""

    def __init__(self):
        self.active_conversation_count = 0

    def process_query(self, app_id: str, query: str) -> Dict[str, Any]:
        """
        处理用户查询

        Args:
            app_id (str): 应用ID
            query (str): 用户查询

        Returns:
            Dict[str, Any]: 处理结果
        """
        start_time = time.time()

        try:
            # 模拟处理时间
            time.sleep(0.1 + (hash(query) % 100) / 1000)

            # 模拟处理逻辑
            response = {
                "answer": f"这是对'{query}'的回答",
                "confidence": 0.95,
                "sources": ["document_1.pdf", "document_2.txt"]
            }

            # 更新监控指标
            conversations_total.labels(app_id=app_id).inc()
            messages_total.labels(app_id=app_id, message_type="user").inc()
            messages_total.labels(app_id=app_id, message_type="assistant").inc()

            return response

        except Exception as e:
            # 记录错误
            messages_total.labels(app_id=app_id, message_type="error").inc()
            logger.error(f"处理查询时发生错误: {e}")
            raise

        finally:
            # 记录处理时间
            duration = time.time() - start_time
            logger.info(f"查询处理完成,耗时: {duration:.3f}秒")


# 初始化处理器
processor = RAGFlowProcessor()


@app.route('/metrics')
def metrics():
    """Prometheus指标端点"""
    return generate_latest()


@app.route('/chat', methods=['POST'])
def chat():
    """
    聊天接口
    """
    start_time = time.time()
    method = request.method
    endpoint = request.path

    try:
        # 解析请求数据
        data = request.get_json()
        app_id = data.get('app_id', 'default')
        query = data.get('query', '')

        if not query:
            http_requests_total.labels(
                method=method,
                endpoint=endpoint,
                status='400'
            ).inc()
            return jsonify({"error": "查询内容不能为空"}), 400

        # 增加活跃对话数
        processor.active_conversation_count += 1
        active_conversations.labels(app_id=app_id).set(processor.active_conversation_count)

        # 处理查询
        result = processor.process_query(app_id, query)

        # 减少活跃对话数
        processor.active_conversation_count -= 1
        active_conversations.labels(app_id=app_id).set(processor.active_conversation_count)

        # 记录成功请求
        http_requests_total.labels(
            method=method,
            endpoint=endpoint,
            status='200'
        ).inc()

        # 记录处理时间
        duration = time.time() - start_time
        http_request_duration_seconds.labels(
            method=method,
            endpoint=endpoint
        ).observe(duration)

        return jsonify(result)

    except Exception as e:
        # 记录失败请求
        http_requests_total.labels(
            method=method,
            endpoint=endpoint,
            status='500'
        ).inc()

        # 记录处理时间
        duration = time.time() - start_time
        http_request_duration_seconds.labels(
            method=method,
            endpoint=endpoint
        ).observe(duration)

        logger.error(f"处理聊天请求时发生错误: {e}")
        return jsonify({"error": "内部服务器错误"}), 500


@app.route('/health')
def health():
    """
    健康检查接口
    """
    return jsonify({"status": "healthy"})


def update_system_metrics():
    """
    定期更新系统指标
    """
    import psutil
    import random

    system_cpu_percent = Gauge('system_cpu_percent', 'System CPU usage percentage')
    system_memory_percent = Gauge('system_memory_percent', 'System memory usage percentage')

    while True:
        try:
            # 模拟系统指标更新
            cpu_percent = psutil.cpu_percent(interval=1)
            memory_percent = psutil.virtual_memory().percent

            system_cpu_percent.set(cpu_percent)
            system_memory_percent.set(memory_percent)

        except Exception as e:
            logger.error(f"更新系统指标时发生错误: {e}")

        # 每30秒更新一次
        time.sleep(30)


if __name__ == '__main__':
    # 启动Prometheus指标服务器
    start_http_server(8000)
    logger.info("Prometheus指标服务器已在端口8000启动")

    # 启动系统指标更新线程
    metrics_thread = threading.Thread(
        target=update_system_metrics,
        daemon=True,
        name="MetricsUpdater"
    )
    metrics_thread.start()
    logger.info("系统指标更新线程已启动")

    # 启动Flask应用
    app.run(host='0.0.0.0', port=5000, debug=False)
9. 注意事项
在使用Prometheus监控RAGFlow时,需要注意以下几点:
9.1 配置文件正确性
确保Prometheus的配置文件prometheus.yml中的metrics_path和targets配置正确:
scrape_configs:
  - job_name: 'ragflow'
    metrics_path: '/metrics'
    static_configs:
      - targets: ['localhost:8000']  # 确保端口和地址正确
9.2 网络访问权限
确保Prometheus服务可以访问RAGFlow服务的IP地址和端口。如果部署在不同服务器上,需要配置防火墙规则:
# 开放端口示例(CentOS/RHEL)
firewall-cmd --add-port=8000/tcp --permanent
firewall-cmd --reload

# 开放端口示例(Ubuntu)
ufw allow 8000/tcp
9.3 性能考虑
监控系统本身也会消耗资源,需要注意:
- 合理设置抓取间隔,避免过于频繁的抓取影响性能
- 只监控关键指标,避免监控过多指标导致存储压力
- 定期清理过期的监控数据
9.4 安全性
确保监控系统的安全性:
- 限制对监控端点的访问权限
- 使用HTTPS加密传输敏感数据
- 定期更新Prometheus和Grafana到最新版本
10. 最佳实践
10.1 指标设计原则
设计监控指标时应遵循以下原则:
- 命名规范:使用清晰、一致的命名规范
- 标签使用:合理使用标签进行维度区分
- 指标类型:根据数据特点选择合适的指标类型(Counter、Gauge、Histogram等)
- 粒度控制:避免过度细化或过于粗略
10.2 告警策略
设置合理的告警策略:
10.3 性能优化
优化监控系统性能:
- 调整抓取配置:根据实际需求调整Prometheus的
scrape_interval和evaluation_interval参数 - 数据保留策略:设置合理的数据保留时间,避免存储空间耗尽
- 资源分配:为Prometheus分配足够的CPU和内存资源
10.4 监控关键指标
重点关注以下关键指标:
11. 常见问题
11.1 Prometheus无法抓取RAGFlow指标
问题描述:Prometheus无法从RAGFlow服务抓取指标数据
解决方案:
- 检查RAGFlow服务是否已正确启用了Prometheus指标端点
- 确认Prometheus配置文件中的
metrics_path和targets配置正确 - 检查网络连接,确保Prometheus可以访问RAGFlow服务
- 查看RAGFlow服务日志,确认指标端点是否正常工作
11.2 Grafana无法连接Prometheus数据源
问题描述:Grafana无法连接到Prometheus数据源
解决方案:
- 检查Prometheus服务是否正常运行
- 确认Grafana中配置的Prometheus地址是否正确
- 检查网络连接和防火墙设置
- 验证Prometheus的API是否可以正常访问
11.3 告警误报过多
问题描述:监控系统产生大量误报
解决方案:
- 调整告警阈值,使其更符合实际业务情况
- 增加告警评估时间窗口,避免瞬时波动触发告警
- 优化告警规则,增加更多的判断条件
- 定期审查和调整告警策略
11.4 监控数据存储空间不足
问题描述:Prometheus存储的监控数据占用过多磁盘空间
解决方案:
- 设置合理的数据保留时间,定期清理过期数据
- 调整抓取间隔,减少数据采集频率
- 使用远程存储方案,将历史数据存储到其他系统
- 增加存储空间或优化存储配置
12. 扩展阅读
以下是一些扩展阅读资源,帮助您深入了解Prometheus监控和RAGFlow应用:
13. 总结
通过本文的介绍,您应该能够成功配置Prometheus来监控RAGFlow系统的运行状态和性能指标。我们从基础概念入手,详细讲解了Prometheus和RAGFlow的基本原理,然后逐步深入到实际配置和监控实践。
关键要点总结:
- 指标设计:合理设计业务和系统指标,全面反映系统状态
- 监控配置:正确配置Prometheus和Grafana,实现有效监控
- 告警策略:设置合理的告警规则,及时发现系统问题
- 性能优化:根据实际运行情况,不断优化监控策略
- 故障排查:建立完善的监控体系,支持快速故障定位
监控是确保系统稳定性和性能的关键,希望本文对您有所帮助。如果您在实践中遇到任何问题,欢迎随时交流。
参考资料
版权声明:本文为原创文章,未经授权禁止转载。如需转载请联系我们获得授权。


 401
401


 到【灌水乐园】发言


