


 本文介绍了如何使用Python库pyecharts创建柱状图、饼图和玫瑰图等基本图表,并演示了添加数据、配置选项和在Jupyter Notebook中展示的过程。通过实例展示了如何设置标题、轴标签和图例,适合初学者入门学习.
pyecharts基本上的图表类型绘制:
chart_name=Type() #初始化具体类型图表
chart_name.add() #添加数据及配置项
chart_name.render() #生成本地文件(html/svg/jpeg/png/pdf/gif)
chart_name.render_notebook #在jupyter notebook中显示
一、安装pyecharts
打开cmd直接输入
pip install pyecharts
或者加入清华镜像
pip install pyecharts -i https://pypi.tuna.tsinghua.edu.cn/simple/
OK!最后安装成功,那么我们开始写代码看看是否能够成功运行
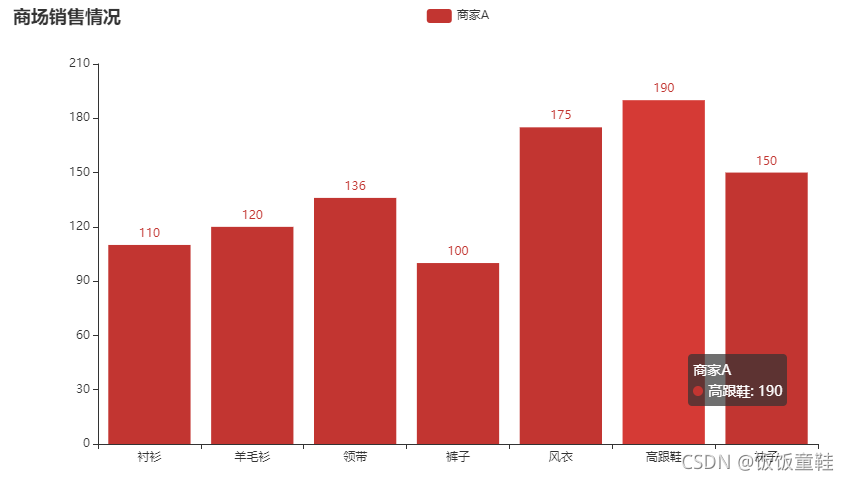
二、使用bar函数绘制柱状图
add_xaxis 加入X轴参数
add_yaxis 加入Y轴参数,可以设置Y轴参数,也可在全局设置中设置,多个add_yaxis 可以设置并列柱状图
set_global_opts 全局配置设置
set_series_opts 系列配置设置
from pyecharts.charts import Bar
from pyecharts import options as opts
%matplotlib inline

bar = Bar()
bar.add_xaxis(["衬衫", "羊毛衫", "领带", "裤子", "风衣", "高跟鞋", "袜子"])
bar.add_yaxis("商家A", [110, 120, 136, 100, 175, 190, 150])
bar.set_global_opts(title_opts=opts.TitleOpts(title="商场销售情况"))
bar.render_notebook()
# bar.render()  #生成html
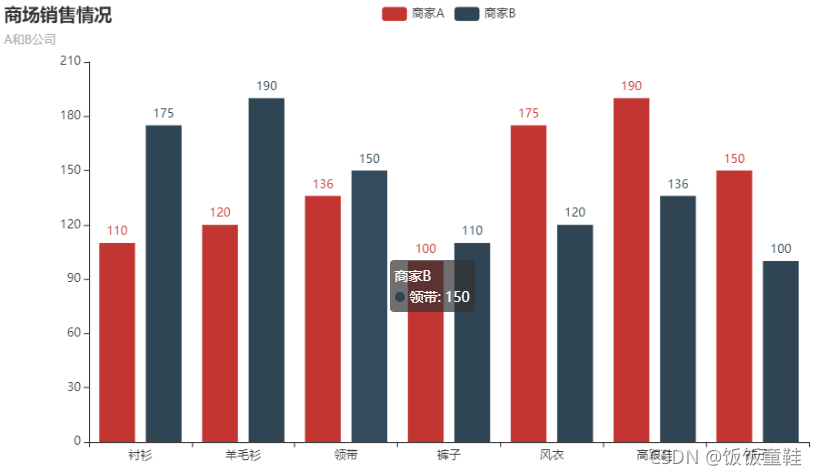
绘制并列柱状图
bar.add_xaxis(["衬衫", "羊毛衫", "领带", "裤子", "风衣", "高跟鞋", "袜子"])
bar.add_yaxis("商家A", [110, 120, 136, 100, 175, 190, 150])
bar.add_yaxis("商家B", [175, 190, 150, 110, 120, 136, 100])
bar.set_global_opts(title_opts=opts.TitleOpts(title="商场销售情况",subtitle="A和B公司"))
bar.render_notebook()
# bar.render()  #生成html
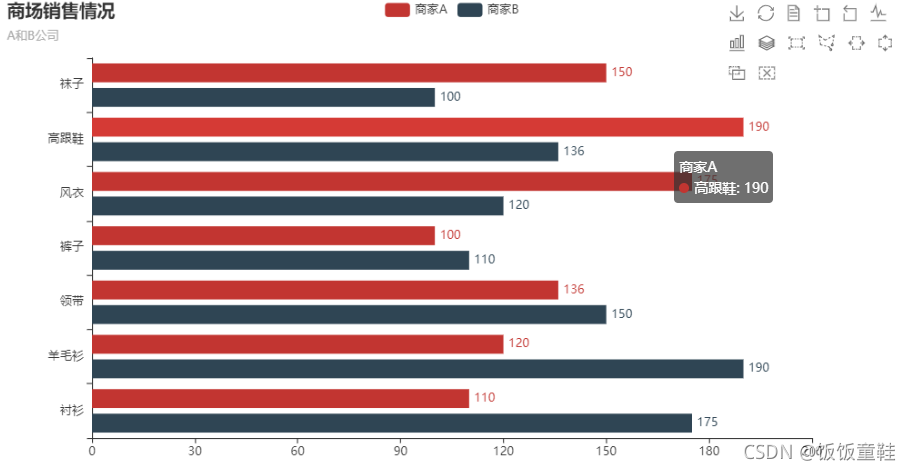
水平直方图
#水平直方图
bar.set_global_opts(title_opts=opts.TitleOpts(title="商场销售情况",subtitle="A和B公司"),toolbox_opts=opts.ToolboxOpts(is_show=True))
bar.set_series_opts(label_opts=opts.LabelOpts(position="right"))
bar.reversal_axis()   #水平直方图绘制
bar.render_notebook()
# bar.render()  #生成html
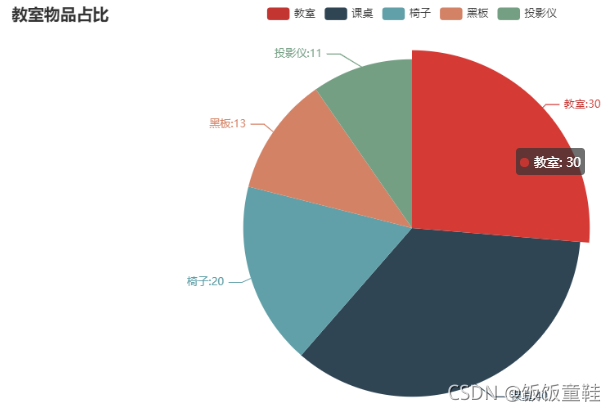
三、绘制饼图
pie.add的方法中,参数radius用于设置饼图半径,默认为[0,75],第一项为内半径,第二项为外半径;
参数center用于设置饼图中心坐标,默认为[50,50];
参数rosetype用于设置南丁格尔图(玫瑰图),有两种表现形式,分别是radius和area。
from pyecharts.charts import Pie
L1=['教室','课桌','椅子','黑板','投影仪']
num=[30,40,20,13,11]
c=Pie()
c.add("",[list(z) for z in zip(L1,num)])
c.set_global_opts(title_opts=opts.TitleOpts(title="教室物品占比"))
c.set_series_opts(label_opts=opts.LabelOpts(formatter="{b}:{c}"))
c.render_notebook()
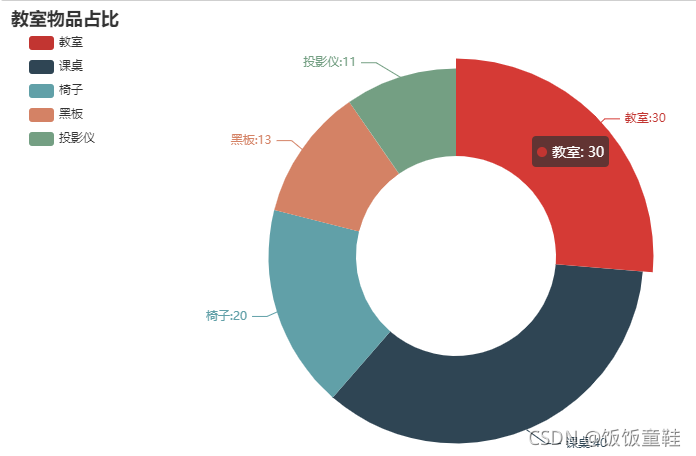
绘制圆形饼图
wd=['教室','课桌','椅子','黑板','投影仪']
num=[30,40,20,13,11]
c=Pie()
c.add("",[list(z) for z in zip(wd,num)],radius=["40%","75%"])
#圆环的粗细和大小
c.set_global_opts(title_opts=opts.TitleOpts(title="教室物品占比"),
                 legend_opts=opts.LegendOpts(orient="vertical",pos_top="5%",pos_left="2%"))
c.set_series_opts(label_opts=opts.LabelOpts(formatter="{b}:{c}"))
c.render_notebook()
wd=['教室','课桌','椅子','黑板','投影仪']
num=[30,40,20,13,11]
c=Pie()
c.add("",[list(z) for z in zip(wd,num)],radius=["40%","55%"],
     label_opts=opts.LabelOpts(position='outside',
                               formatter="{a|{a}}{abg|}\n{hr|}\n{b|{b}:}{c}{per|{d}%}",
                               background_color="#eee",border_color="#aaa",
                               border_width=1,border_radius=4,
                               rich={"a":{"color":"#999","lineHeight":22,"align":"center"},
                                    "abg":{"backgroundColor":"#e3e3e3","width":"100%",
                                    "align":"right","height":22,"borderRadius":[4,4,0,0],},
                               "hr":{"borderColor":"#aaa","width":"100%",
                                    "borderWidth":0.5,"height":0,},"b":{"fontSize":16,
                                                                       "lineHeight":33},"per":{"color":"#eee",
                                                                                              "backgroundColor":"#334455","padding":[2,4],"borderRadius":2,
                                                                                              }}))
c.set_global_opts(title_opts=opts.TitleOpts(title="教室物品占比"))
c.render_notebook()

绘制玫瑰图
wd=['教室','课桌','椅子','黑板','投影仪']
num=[30,40,20,13,11]
c=Pie()
c.add("",[list(z) for z in zip(wd,num)],radius=["40%","55%"],center=[240,220],rosetype='radius')
c.add("",[list(z) for z in zip(wd,num)],radius=["40%","55%"],center=[620,220],rosetype='area')
c.set_global_opts(title_opts=opts.TitleOpts(title="玫瑰图"))
c.render_notebook()


 2196
2196


 到【灌水乐园】发言


