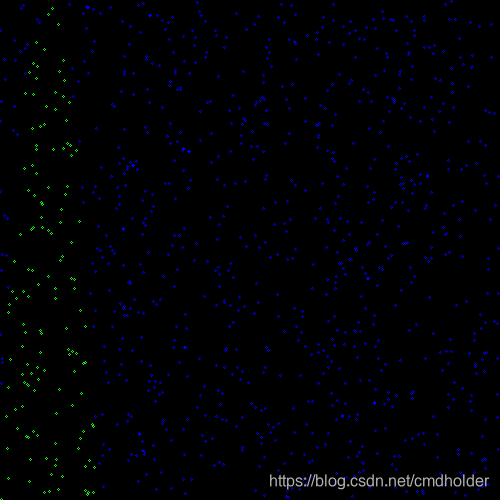
首先随机生成10000个training数据X(x1, x2), x1, x2取值范围都为0-500随机数。
我们把x1, x2当作一个点(x, y) 的两个特征放在二维平面可以很直观看到training数据的分布。
然后取一个分界线,这里随便弄个抛物线:
A = 0.2
B = -20
C = 500
y = A * p_x1 ** 2 + B * p_x1 + C
如果training数据在这个抛物线的上方,我们显示为绿色1,在抛物线下方我们显示为蓝色0, 所以我们label Y 为0或者1.
相关代码:
p_x1 = np.random.rand(10000) * 500
p_x2 = np.random.rand(10000) * 500
p_x_trigger = A * p_x1 ** 2 + B * p_x1 + C

p_x = np.zeros((10000, 2))
p_x[:,0] = p_x1
p_x[:,1] = p_x2
p_y = (p_x2 > p_x_trigger)*1

我们随便组织几层浅层全链接网络来尝试训练:
model.add(Dense(2, activation='relu', input_shape=(2,)))
model.add(Dense(4, activation='relu'))
model.add(Dense(8, activation='relu'))
model.add(Dense(2, activation='softmax'))
只要保证输入和输出的大小为2, 因为我们的类型只有0和1
model.fit(p_x, p_y, batch_size=8, epochs=100, validation_split=0.3)
我们把batch_size设置的不是很大,因为如果设置很大发现训练的时候收敛效果不好。训练好了后我们使用我们的测试数据来测试一下,分类是否符合抛物线的边界:
test_x1 = np.random.rand(1000) * 500
test_x2 = np.random.rand(1000) * 500
test_x_trigger = A * test_x1 ** 2 + B * test_x1 + C

test_x = np.zeros((1000, 2))
test_x[:,0] = test_x1
test_x[:,1] = test_x2
test_y = (test_x2 > test_x_trigger)*1
分类我们的测试数据:
ret = model.predict(test_x)
显示我们的分类结果:

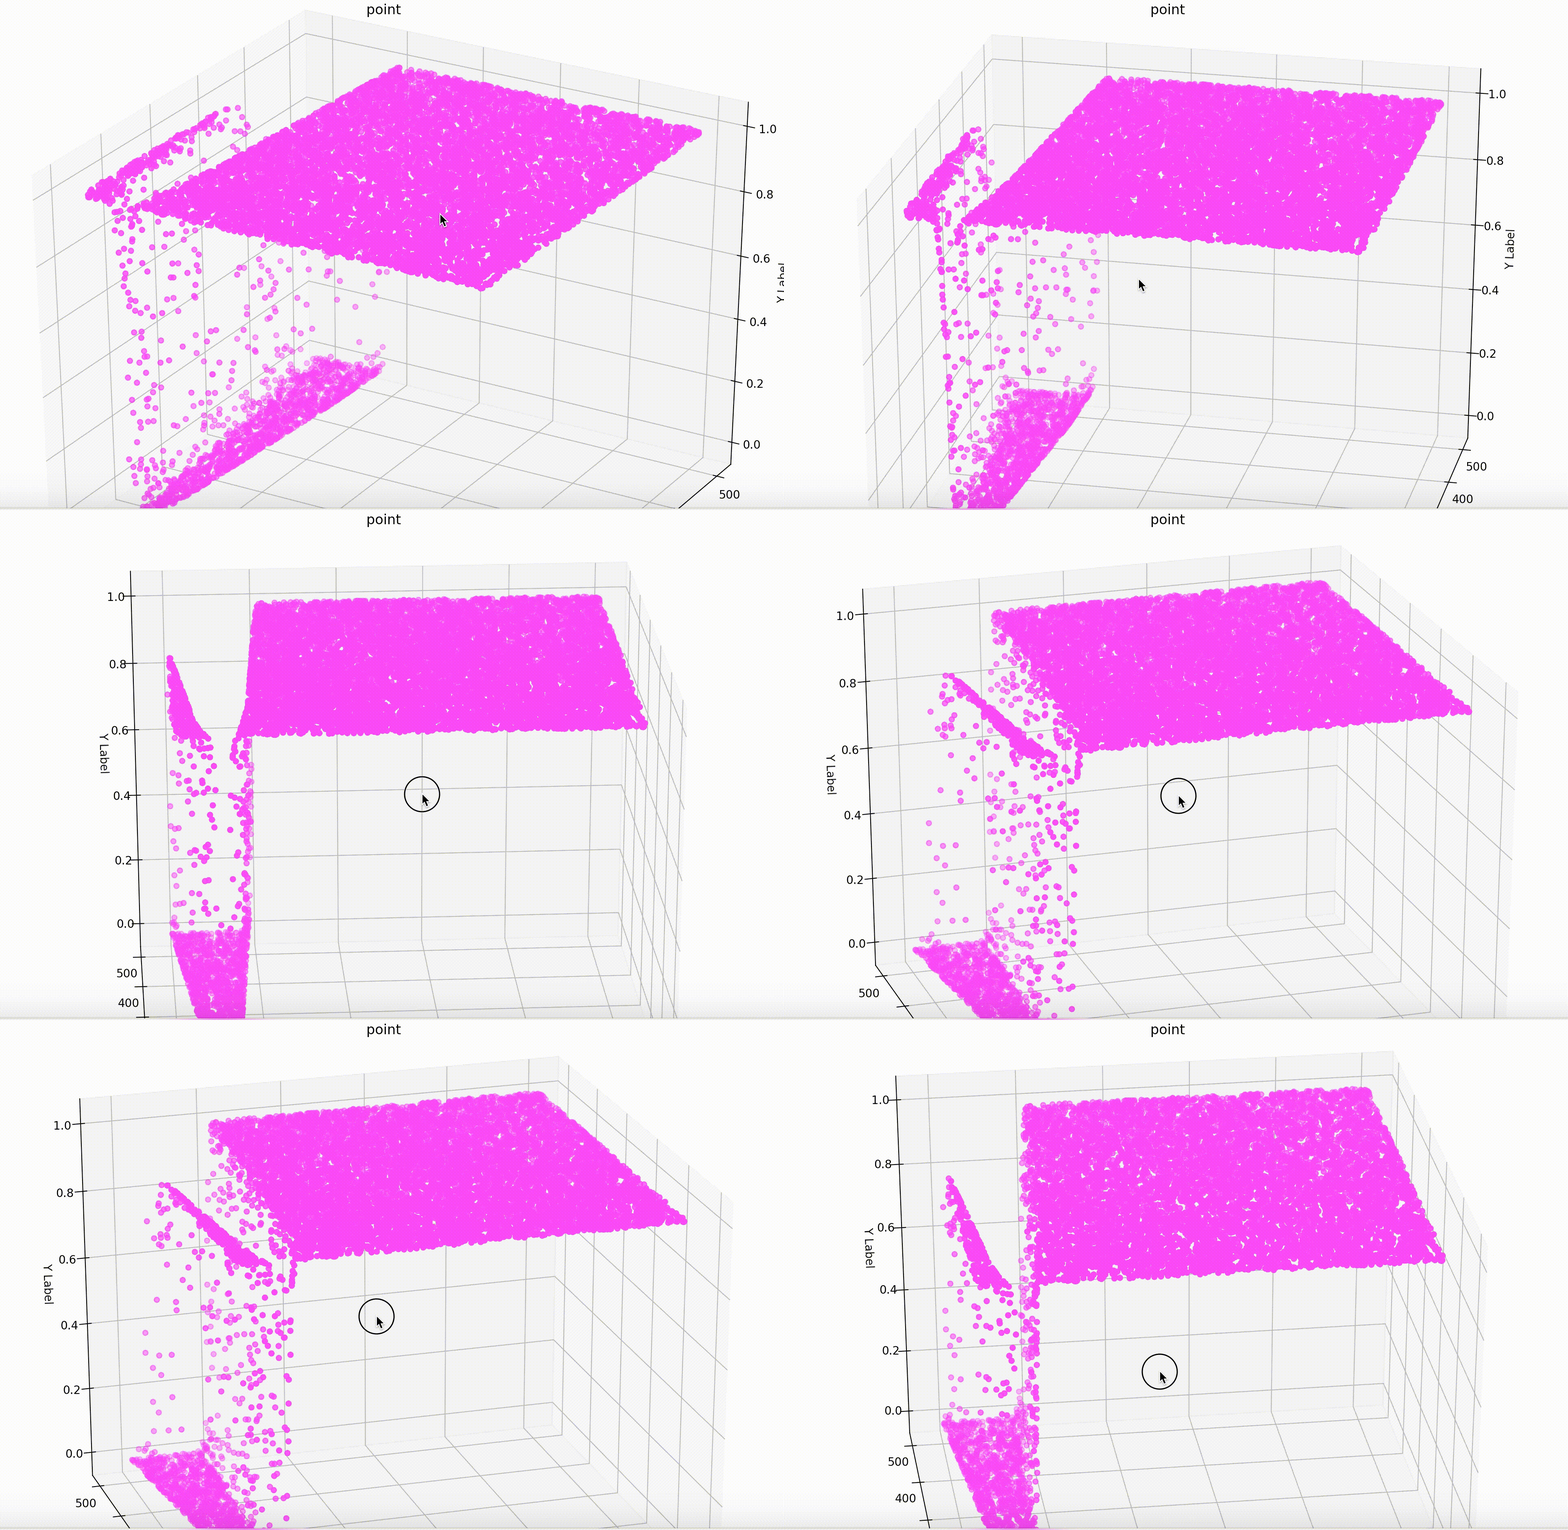
可以看到我们的测试数据被分为两类,符合抛物线边界线区域。训练逻辑层并不知道“抛物线边界线”的概念,但是通过训练一些特征符合抛物线边界的样例数据,获取权重参数能够拟合抛物线分类的能力。分类边界越复杂,需要的参数就趋向越多,网络趋向复杂化。
我们增大测试集数据,然后可以比较详细的看出拟合好后的曲线分布:

完整代码:
#Created by xhpan on 12/12/2018
import numpy as np
from keras import backend as K
from keras.models import Sequential
from keras.layers import Conv2D, MaxPooling2D
from keras.layers import Activation, Flatten, Dense, Dropout
from keras.utils import np_utils
from keras.datasets import mnist
from matplotlib import pyplot as plt
import cv2

A = 0.2
B = -20
C = 500

p_x1 = np.random.rand(10000) * 500
p_x2 = np.random.rand(10000) * 500
p_x_trigger = A * p_x1 ** 2 + B * p_x1 + C

p_x = np.zeros((10000, 2))
p_x[:,0] = p_x1
p_x[:,1] = p_x2
p_y = (p_x2 > p_x_trigger)*1

val_x1 = np.random.rand(1000) * 500
val_x2 = np.random.rand(1000) * 500
val_x_trigger = A * val_x1 ** 2 + B * val_x1 + C

val_x = np.zeros((1000, 2))
val_x[:,0] = val_x1
val_x[:,1] = val_x2
val_y = (val_x2 > val_x_trigger)*1

test_x1 = np.random.rand(10000) * 500
test_x2 = np.random.rand(10000) * 500
test_x_trigger = A * test_x1 ** 2 + B * test_x1 + C

test_x = np.zeros((10000, 2))
test_x[:,0] = test_x1
test_x[:,1] = test_x2
test_y = (test_x2 > test_x_trigger)*1

p_y = np_utils.to_categorical(p_y, 2)
val_y = np_utils.to_categorical(val_y, 2)
test_y = np_utils.to_categorical(test_y, 2)

model = Sequential()

model.add(Dense(2, activation='relu', input_shape=(2,)))
model.add(Dense(4, activation='relu'))
model.add(Dense(8, activation='relu'))
# model.add(Dense(128, activation='relu'))
# model.add(Dense(128, activation='relu'))

# model.add(Dropout(0.6))

model.add(Dense(2, activation='softmax'))

model.compile(loss='categorical_crossentropy',
              optimizer='adam',
              metrics=['accuracy'])
if False:
    model.fit(p_x, p_y,
          batch_size=8, epochs=100, validation_split=0.3)
    score = model.evaluate(val_x,  val_y)
    print(score)
    model.save_weights("parabola_wight.wf")
else:
    model.load_weights("parabola_wight.wf")

    from keras.utils import plot_model
    plot_model(model, to_file='parabola_model.png')

    im_train = np.zeros((500, 500, 3))
    for _, (x, y) in enumerate(p_x):
        cv2.circle(im_train, (int(x), int(y)), 1, (255, 0, 0) if p_y[_][0] == 1 else (0, 255, 0), thickness=1)
    cv2.imwrite("parabola_train.png", im_train)
    cv2.imshow("parabola_train", im_train)

    ret = model.predict(test_x)
    im = np.zeros((500, 500, 3))
    im_gt = np.zeros((500, 500, 3))
    for _, (x, y) in enumerate(test_x):
        cv2.circle(im, (int(x), int(y)), 1, (255, 0, 0) if ret[_][0] > 0.6 else (0, 255, 0), thickness=1)
    cv2.imwrite("parabola.png", im)
    cv2.imshow("parabola", im)

    parabola_x = np.arange(0, 100, 1)
    parabola_y = A * parabola_x ** 2 + B * parabola_x + C

    parabola_pts = np.zeros((100, 2))
    parabola_pts[:, 0] = parabola_x
    parabola_pts[:, 1] = parabola_y
    parabola_pts = parabola_pts.astype("int")

    cv2.polylines(im_gt, [parabola_pts], False, (255, 255, 255), thickness=5)
    cv2.imwrite("parabola_gt.png", im)
    cv2.imshow("parabola_gt", im_gt)

    import matplotlib.pyplot as plt
    import mpl_toolkits.mplot3d
    from matplotlib import cm
    fig = plt.figure(figsize=(16,12))
    ax = plt.subplot(111, projection="3d")
    z = ret[:, 0]
    ax.scatter(test_x[:, 0], test_x[:, 1], ret[:, 0], c=(1,0,1), marker='o')

    # surf = ax.plot_surface(test_x[:,0], test_x[:,1], ret[:,0], rstride=2,cstride=1, cmap=plt.cm.coolwarm, alpha=0.8)
    ax.set_xlabel('X Label')
    ax.set_ylabel('Z Label')
    ax.set_zlabel('Y Label')
    plt.title('point')
    plt.show()
    cv2.waitKey(0)

    # raw_input('Press Enter to exit...')


 本文通过Keras构建浅层全链接网络,展示非线性分类。利用10000个二维特征的训练数据,模拟抛物线分界线,训练网络以达到分类目的。实验表明,即使网络简单,也能通过训练拟合复杂边界,如抛物线。增加测试数据可观察更细致的分类效果。


 7万+
7万+

 被折叠的 条评论
为什么被折叠?


