


 本文探讨了matplotlib与pyqtgraph在绘图上的异同,介绍了如何在PyQt5中实现与matplotlib的结合,并详细阐述了pyqtgraph的功能特点,包括实时更新、交互式操作和自定义布局等。同时,提供了相关的代码示例和资源链接,帮助读者更好地理解和应用这些图形库。
目录
参考文章:https://blog.youkuaiyun.com/qq_39105012/article/details/88584124
matplotlib两种绘图api说明:https://blog.youkuaiyun.com/theonegis/article/details/81230211
一,绘图matplotlib和pyqtgraph的异同点
相对于没有matplotlib功能完整成熟,但运行速度更快。matplotlib面向高质量图形绘制,而pyqtgraph更侧重于数据获取及分析等应用。matplotlib并不包含pyqtgraph所提供的图形交互,渲染,参数数,流程图等。尤其是显示时间序列的实时行情图时,matplotlib在性能上不是很好。由于pyqtgraph绘图是基于pyqt开发的继承绘图模块,所以在速度上与底层的pyqt绘图没有太大区别
二,实现与matplotlib的结合
import sys
import matplotlib.pyplot  as plt
from matplotlib.backends.backend_qt5agg import FigureCanvasQTAgg as FigureCanvas
from PyQt5.QtWidgets import QMainWindow,QApplication,QTableView,QVBoxLayout,QWidget,QPushButton
from PyQt5.QtCore import Qt
import numpy as np


class Demo(QWidget):
    def __init__(self):
        super().__init__()

        layout=QVBoxLayout(self)

        self.figure=plt.figure(facecolor='#FFD7C4')
        self.canves=FigureCanvas(self.figure)
        self.btn=QPushButton('绘图')

        layout.addWidget(self.canves)
        layout.addWidget(self.btn)

        self.btn.clicked.connect(self.Drawlib)

    def Drawlib(self):
        agelist=['10','19','15','13']
        namelist=['jack','tom','jerry','tim']

        agelist=list(map(int,agelist))
        self.x=np.arange(len(namelist))
        self.y=np.array(agelist)

        plt.bar(range(len(namelist)),agelist,tick_label=namelist,color='blue',width=0.5)
        plt.title('demo')
        for i,j in zip(self.x,self.y):
            plt.text(i,j+0.5,'%d'%j,ha='center',va='center')

        self.canves.draw()


if __name__=='__main__':

    app=QApplication(sys.argv)
    demo=Demo()
    demo.show()


    sys.exit(app.exec_())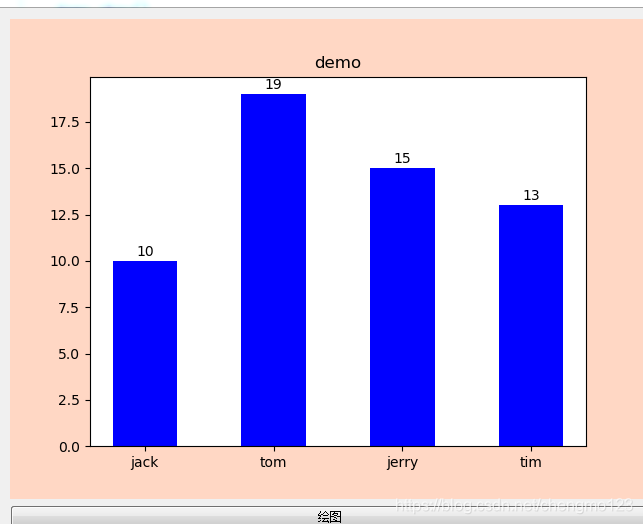
绘图Api说明:
在matplotlib库中提供了两种不同风格的Api:一种是Pyplot编程接口,一种是面向对象的编程接口
一,pyplot封装了底层的绘图函数,可以直接像matlab一样绘图。当我们使用import matplotlib.pyplot as plt语句导入pyplot模块,并使用plt.plot()绘制图形的时候,默认的Figure以及Axes等对象会自动创建以支持图形的绘制
二,在使用面向对象编程接口时,需要自己创建画布(FigureCanvas),自己创建图对象(Figure),自己创建Axes(一个figure可以包含一个或多个axes,一个axes可以理解为一个子图,使用一次plot()绘图函数便会创建一个axes)。所有对象一起才能完成一次完整的绘图,使用面向对象编程接口有利于我们对图形绘制的完整控制。
例子:
Pyplot接口
import matplotlib.pyplot as plt

plt.plot([1,2,3,4])
plt.title('pyplot')
plt.xlabel('x')
plt.ylabel('y')
plt.show()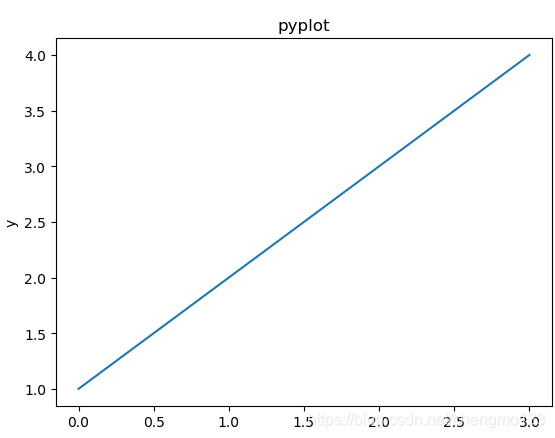
面向对象backendls例子:
import matplotlib.pyplot as plt
from matplotlib.backends.backend_agg import FigureCanvasAgg as FigureCanvas

figure=plt.figure()
canvas=FigureCanvas(figure)

ax=figure.add_subplot(111)#  111表示1*1的网格,第一个子图
ax.plot([1,2,3,4])
ax.set_title('figurecanvas')
ax.set_xlabel('x')
ax.set_ylabel('y')

figure.savefig('fig.jpg',dpi=120)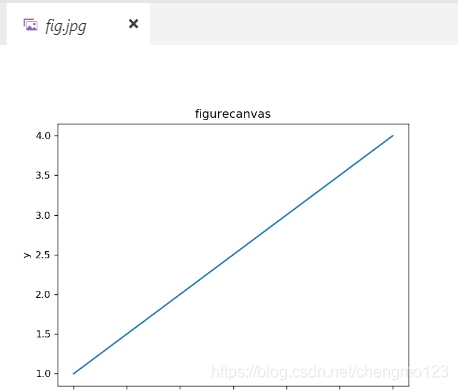
总结:使用面向对象借口哦偶用更多的代码,但绘制过程更加明了。注意:使用面向对象接口不能使用交互式show()方法对图像直接进行显示
openGL:功能强大的二维,三维专业图形绘制工具
Matplotlib:经典的图形绘制模块
PyqtGraph:基于qt平台,提供交互的数据显示图形绘制
三,pyqtgraph的介绍
参考博客:https://zmister.com/archives/187.html
官网文档:http://www.pyqtgraph.org/documentation/graphicsItems/axisitem.html?highlight=axisitem
官网github:https://github.com/pyqtgraph/pyqtgraph
pyqtgraph设置x坐标显示:https://stackoverflow.com/questions/31775468/show-string-values-on-x-axis-in-pyqtgraph
功能:
• 基本可视化:图片、线条及散点图
• 视频及绘图数据的快速、实时更新
• 交互式缩放、平移、FFTs及SVG/PNG图片导出功能
• 标记或选择绘图区域
• 自动选择图片区域,并进行高维切片操作
• 创建自定义图片区域
• 提供更复杂的布局管理组件
• 提供参数树功能(类似Qt Designer中的属性树)
使用pyqtgraph的一个好处是通过两行代码可以看出所有官方示例:
import pyqtgraph.examples as graph
graph.run()
例子:
import sys
from PyQt5.QtWidgets import QApplication,QMainWindow,QVBoxLayout,QWidget,QPushButton
import pyqtgraph as pg
import numpy as np
class Demo(QWidget):
    def __init__(self):
        super().__init__()
        self.initUI()

    def initUI(self):
        self.setWindowTitle('graphDemo')
        layout=QVBoxLayout(self)

        #pyqtgraph 绘图函数
        plt=pg.PlotWidget()  #生成控件方便加入pyqt控件中
        x=np.array([1,2,3])
        y=np.array([1,2,3])
        x_labels=np.array(['tom','jerry','jack'])
        xlist=[list(zip(x,x_labels))]  #或者 zip(np.arange(len(x),x_labels))
        plt.plot(x,y)
        xax=plt.getAxis('bottom')   #getAxis 返回的为 AxisItem对象
        xax.setTicks(xlist)


        # 将控件布局到界面中
        layout.addWidget(plt)
        layout.addWidget(QPushButton("dianji"))


if __name__ == "__main__":
    app=QApplication(sys.argv)
    demo=Demo()
    demo.show()

    sys.exit(app.exec_())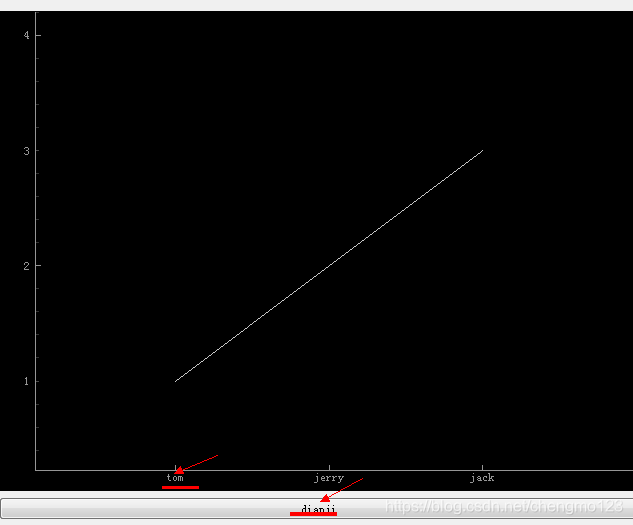
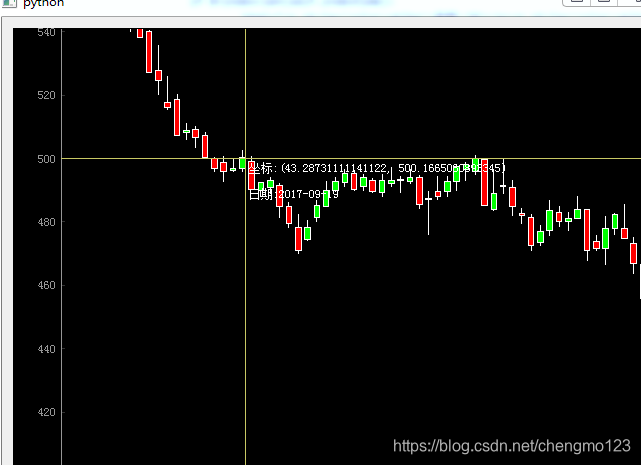
案例二:与鼠标的交互
参考:https://zmister.com/archives/793.html 绘制十字光标
官网的github:https://github.com/pyqtgraph
https://baijiahao.baidu.com/s?id=1623441546635160463&wfr=spider&for=pc 绘制具状
# 流程:
# 1,得到数据绘制
# 2,矩形坐标成为Item
# 3,pyqtgraph画图生成控件plotwidget
# 4,将矩形item元素加入控件
# 5,pyqt5界面添加控件
#7,鼠标移动事件,显示十字和信息

import tushare as ts   #数据包里面含有指数数据
import pyqtgraph as pg
from PyQt5.QtGui import QPicture,QPainter
from PyQt5.QtCore import QPointF,QRectF
from PyQt5.QtWidgets import QApplication,QWidget,QVBoxLayout
import sys
#1,得到数据
class GetData():
	def __init__(self):
		self.data=ts.get_hist_data('600519',start='2017-05-01',end='2017-11-24') #联网下才有效
	#1.1,传递数据进行绘制矩形
	def covery_data(self):
		t=0
		listdata=[]
		for index ,row in self.data.iterrows():
			open,hight,close,low=row[:4]
			datas=(t,open,close,hight,low)
			listdata.append(datas)
			t+=1
		return listdata

	def covery_time(self):
		return self.data.index


#2,绘制矩形得到Item
class DrawRecrItem(pg.GraphicsObject):
	def __init__(self,data):
		super().__init__()
		self.data=data
		self.draw_rect()

	def draw_rect(self):
		self.picture=QPicture()
		p1=QPainter(self.picture)
		p1.setPen(pg.mkPen('w'))
		for (t,open,close,max,min) in self.data:

			#画一条最大值最小值之间的线
			p1.drawLine(QPointF(t,min),QPointF(t,max))
			if open>close:
				p1.setBrush(pg.mkBrush('g'))
			else:
				p1.setBrush(pg.mkBrush('r'))
			p1.drawRect(QRectF(t-0.3,open,0.6,close-open))

	def paint(self,p,*args):  #参数p应该是自带的画图
		p.drawPicture(0,0,self.picture)
	def boundingRect(self):
		return QRectF(self.picture.boundingRect())

class QtDemo(QWidget):
	def __init__(self):
		super().__init__()
		self.Data=GetData()
		self.listdata=self.Data.covery_data()
		self.indextime=self.Data.covery_time()
		self.initUi()
	def initUi(self):
		layout=QVBoxLayout(self)

		item=DrawRecrItem(self.listdata)
		#3,将iTem加入到plotwidget控件中
		self.plt=pg.PlotWidget()
		self.plt.addItem(item)

		#4,将控件添加到pyqt中
		layout.addWidget(self.plt)

		#5,鼠标移动事件
		self.plt.scene().sigMouseMoved.connect(self.mouseMove)
		self.label=pg.TextItem()
		self.plt.addItem(self.label)
		# 十字
		self.vline=pg.InfiniteLine(angle=90,movable=False)
		self.hline=pg.InfiniteLine(angle=0,movable=False)
		self.plt.addItem(self.vline,ignoreBounds=False)
		self.plt.addItem(self.hline,ignoreBounds=False)
	def mouseMove(self,event):
		pos=event
		if self.plt.sceneBoundingRect().contains(pos):
			mousePoint=self.plt.plotItem.vb.mapSceneToView(pos) #将鼠标的在图上的位置转为坐标点
			mousepos_x=mousePoint.x()
			mousepos_y=mousePoint.y()
			#绘制移动十字
			self.vline.setPos(mousepos_x)
			self.hline.setPos(mousepos_y)
			#绘制信息,显示的坐标取整数
			index=int(mousePoint.x())
			# pos_y=int(mousePoint.y())

			if 0<index<len(self.indextime):
				html="<p style='color:white'>坐标:{0}</p><p style='color:white'>日期:{1}</p>".format((mousepos_x,mousepos_y),self.indextime[index])
				self.label.setHtml(html)
				self.label.setPos(mousepos_x,mousepos_y)


if __name__=='__main__':
	app=QApplication(sys.argv)
	demo=QtDemo()
	demo.show()
	sys.exit(app.exec_())


 1986
1986

 被折叠的 条评论
为什么被折叠?
被折叠的 条评论
为什么被折叠?
 到【灌水乐园】发言


