


 本文展示了如何利用Maptalks库在地图上绘制四个由ArcCurve表示的圆弧,并用LineString将它们连接起来。代码中,首先创建地图,设置基础图层,然后根据数据生成圆弧坐标并绘制,最后将圆弧和线条添加到图层中,形成闭合的图形结构。
效果图
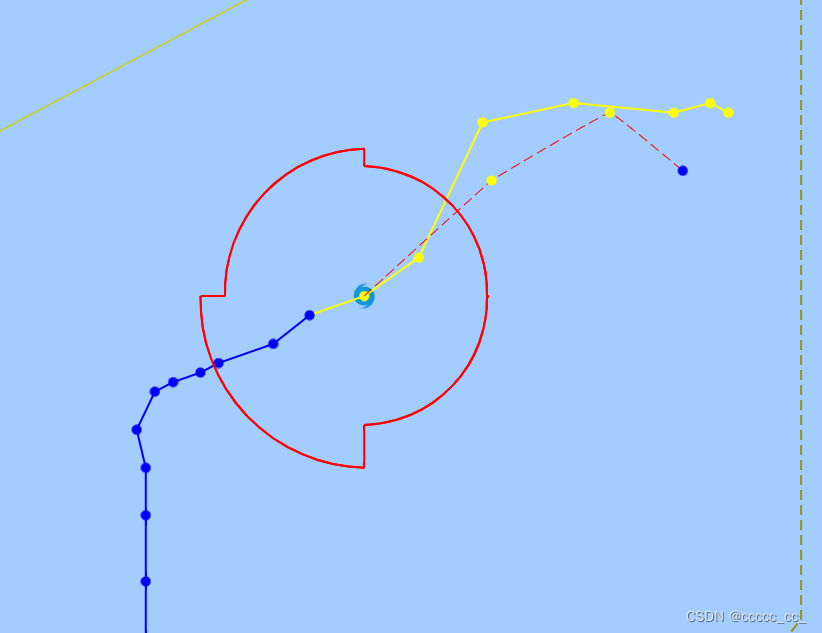
使用ArcCurve绘制了4个圆弧,然后使用LineString进行连接
   const map = new maptalks.Map('map', {
      center: [118.8055, 32.0267],
      zoom: 14,
      baseLayer: new maptalks.TileLayer('base', {
        'urlTemplate': 'http://webrd{s}.is.autonavi.com/appmaptile?lang=zh_cn&size=1&scale=1&style=8&x={x}&y={y}&z={z}'',
        'subdomains': ['a', 'b', 'c'],
        'attribution': '© OpenStreetMap contributors'
      })
    });
            const layer = map.value.getLayer('storm') || new VectorLayer('storm',null,{ zIndex:12 }).addTo(map.value);
         const range =['30KTS', 200, 150, 180, 180, 2826352] //从后端获取的数据 这里直接模拟了
            if (typeof range[0] !== 'undefined') {
            const center = [item.lon,item.lat]; // 台风中心点经纬度
            //使用中心点和半径计算坐标
            function getArcCoordinates(start, end, radius) {
              const points = [];
              for (let i = start; i <= end; i += 90) {
                const angle = i / 180 * Math.PI;
                const x = center[0] + radius / 111.2 * Math.cos(angle);
                const y = center[1] + radius / 111.2 * Math.sin(angle);
                points.push(new Coordinate(x, y));
              }
              return points
            }
              const point = []
              for (let i = 0; i < 4; i++){
                point.push(getArcCoordinates(0+90*i,90+90*i,range[0][i+1]))
              }
            for (let i = 0; i < 4; i++){
              const arcCurve = new ArcCurve( point[i], {
                        symbol: {
                          lineColor: '#f00',
                          lineWidth: 2,
                        }
              });
              console.log(point);
              //将圆弧的第二个坐标连接下一个圆弧的第一个坐标
              if (i < 3) {
                const arcLine = new LineString([point[i][1],point[i+1][0]],{
                  symbol: {
                    lineColor: '#f00',
                    lineWidth: 2,
                  }
                })
                layer.addGeometry(arcLine)
              } else {
                const arcLine = new LineString([point[i][1],point[0][0]],{
                  symbol: {
                    lineColor: '#f00',
                    lineWidth: 2,
                  }
                })
                layer.addGeometry(arcLine)
              }

              layer.addGeometry([arcCurve])

            }
            }


 942
942

 被折叠的 条评论
为什么被折叠?
被折叠的 条评论
为什么被折叠?
 到【灌水乐园】发言


