


转载:
参考:
- Tag: average precision
- 【YOLO学习】召回率(Recall),精确率(Precision),平均正确率(Average_precision(AP) ),交除并(Intersection-over-Union(IoU))
- 【WSI】《Faster R-CNN-Based Glomerular Detection in Multistained Human Whole Slide Images》
- 准确率(Accuracy), 精确率(Precision), 召回率(Recall)和F1-Measure
文章目录
1 Geese and airplanes
Suppose you have an image collection consisting of airplanes and geese(鹅).

You want your system to retrieve(检索) all the airplane images and none of the geese images.
2 TP、FP、FN、TN

- TP(True Positive) is the case in which the proposed bounding box sufficiently overlaps with the ground truth. 飞机的图片被正确的识别成了飞机。
- FP(False Positive) is the case in which the proposed bounding box overlaps with the ground truth insufficiently. (误检,IoU< thresold),大雁的图片(可以理解为背景)被错误地识别成了飞机(可以理解为目标)。
- FN(False Negative) is the ground truth that could not be detected. (漏检),飞机的图片没有被识别出来,系统错误地认为它们是大雁。
- TN(True Negative),大雁的图片没有被识别出来,系统正确地认为它们是大雁。
假设你的分类系统使用了上述假设识别出了四个结果,如下图所示:

那么在识别出的这四张照片中:
- TP = 3 有三个,画绿色框的飞机
- FP(误检) = 1 有一个,画红色框的大雁
没被识别出来的六张图片中:
- TN = 4 这四个大雁的图片,系统正确地没有把它们识别成飞机。
- FN(漏检) = 2 两个飞机没有被识别出来,系统错误地认为它们是大雁。
3 Precision and Recall
Note:算 precision 和 recall 的时候不会涉及到 TN
p
r
e
c
i
s
i
o
n
=
t
p
t
p
+
f
p
=
t
p
P
′
precision = \frac{tp}{tp + fp} = \frac{tp}{{P}'}
precision=tp+fptp=P′tp
r
e
c
a
l
l
=
t
p
t
p
+
f
n
=
t
p
P
recall = \frac{tp}{tp + fn} = \frac{tp}{P}
recall=tp+fntp=Ptp
上述例子中
precision = 3/(3+1) = 0.75
意味着在识别出的结果中,飞机的图片占75%。
recall = 3/(3+2)= 0.6
意味着在所有的飞机图片中,60%的飞机被正确的识别成飞机.。
4 Adjusting the threshold
你也可以通过调整阈值,来选择让系统识别出多少图片,进而改变Precision 或 Recall 的值。
在某种阈值的前提下(蓝色虚线),系统识别出了四张图片,如下图中所示:

分类系统认为大于阈值(蓝色虚线之上)的四个图片更像飞机。
我们可以通过改变阈值(也可以看作上下移动蓝色的虚线),来选择让系统识别能出多少个图片,当然阈值的变化会导致Precision与Recall值发生变化。比如,把蓝色虚线放到第一张图片下面,也就是说让系统只识别出最上面的那张飞机图片,那么Precision的值就是100%,而Recall的值则是20%。如果把蓝色虚线放到第二张图片下面,也就是说让系统只识别出最上面的前两张图片,那么Precision的值还是100%,而Recall的值则增长到是40%。
下图为不同阈值条件下,Precision与Recall的变化情况:

5 Precision-recall curves
如果你想评估一个分类器的性能,一个比较好的方法就是:观察当阈值变化时,Precision与Recall值的变化情况。如果一个分类器的性能比较好,那么它应该有如下的表现:被识别出的图片中飞机所占的比重比较大,并且在识别出大雁之前,尽可能多地正确识别出飞机,也就是让Recall值增长的同时保持Precision的值在一个很高的水平。而性能比较差的分类器可能会损失很多Precision值才能换来Recall值的提高。通常情况下,文章中都会使用Precision-recall曲线,来显示出分类器在Precision与Recall之间的权衡。

6 Approximated Average precision
相比较与曲线图,在某些时候还是一个具体的数值能更直观地表现出分类器的性能。通常情况下都是用 Average Precision来作为这一度量标准,它的公式为:

在这一积分中,其中p代表Precision ,r 代表Recall,p是一个以r为参数的函数,That is equal to taking the area under the curve.
实际上这一积分极其接近于这一数值:对每一种阈值分别求(Precision值)乘以(Recall值的变化情况),再把所有阈值下求得的乘积值进行累加。公式如下:

(定积分定义)分割,做积,求和,取极限
在这一公式中,N代表测试集中所有图片的个数,P(k)表示在能识别出k个图片的时候Precision的值,而 Delta r(k) 则表示识别图片个数从k-1变化到k时(通过调整阈值)Recall值的变化情况。
在这一例子中,Approximated Average Precision的值
=(1 * (0.2-0)) + (1 * (0.4-0.2)) + (0.66 * (0.4-0.4)) + (0.75 * (0.6-0.4)) + (0.6 * (0.6-0.6)) + (0.66 * (0.8-0.6)) + (0.57 * (0.8-0.8)) + (0.5 * (0.8-0.8)) + (0.44 * (0.8-0.8)) + (0.5 * (1-0.8)) = 0.782.$
=(1 * 0.2) + (1 * 0.2) + (0.66 * 0) + (0.75 * 0.2) + (0.6 * 0) + (0.66 * 0.2) + (0.57 * 0) + (0.5 * 0) + (0.44 * 0) + (0.5 * 0.2) = 0.782.
通过计算可以看到,那些Recall值没有变化的地方(红色数值),对增加 Average Precision值没有贡献。
7 Interpolated average precision
不同于Approximated Average Precision,一些作者选择另一种度量性能的标准:Interpolated Average Precision。这一新的算法不再使用P(k),也就是说,不再使用当系统识别出k个图片的时候Precision的值与Recall变化值相乘。而是使用:

也就是每次使用在所有阈值的Precision中,最大值的那个Precision值与Recall的变化值相乘。公式如下:

下图的图片是Approximated Average Precision 与 Interpolated Average Precision相比较。
需要注意的是,为了让特征更明显,图片中使用的参数与上面所说的例子无关。

很明显 Approximated Average Precision与精度曲线挨的很近,而使用Interpolated Average Precision算出的Average Precision值明显要比Approximated Average Precision的方法算出的要高。
一些很重要的文章都是用Interpolated Average Precision 作为度量方法,并且直接称算出的值为Average Precision 。PASCAL Visual Objects Challenge从2007年开始就是用这一度量制度,他们认为这一方法能有效地减少Precision-recall 曲线中的抖动。所以在比较文章中Average Precision 值的时候,最好先弄清楚它们使用的是那种度量方式。
8 多类别 precision / recall
手推多分类precision(精确率)、recall(召回率)、F1分数
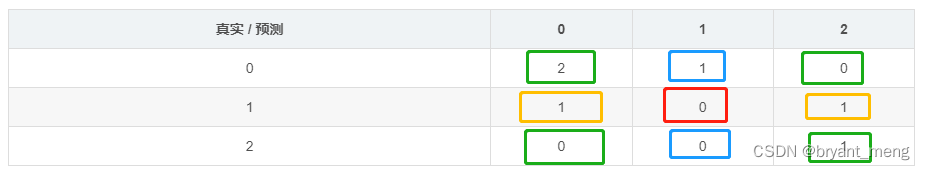
举例
真实值:[0, 1, 0, 0, 1, 2]
预测值:[0, 2, 1, 0, 0, 2]
混淆矩阵
| 真实 / 预测 | 0 | 1 | 2 |
|---|---|---|---|
| 0 | 2 | 1 | 0 |
| 1 | 1 | 0 | 1 |
| 2 | 0 | 0 | 1 |
from sklearn.metrics import confusion_matrix
y_true = [0, 1, 0, 0, 1, 2]
y_pred = [0, 2, 1, 0, 0, 2]
print('confusion_matrix:\n', confusion_matrix(y_true, y_pred))

类别 0

| 真实 / 预测 | P | N |
|---|---|---|
| P | 2 | 1 |
| N | 1 | 2 |
类别 1
| 真实 / 预测 | P | N |
|---|---|---|
| P | 0 | 2 |
| N | 1 | 3 |
类别 2

| 真实 / 预测 | P | N |
|---|---|---|
| P | 1 | 0 |
| N | 1 | 4 |
每个类别的 precision 和 recall 组合起来就是所有类别的 precision 和 recall
9 Code
来自:YOLOv5全面解析教程(四):目标检测模型精确度评估
# 根据PR曲线计算AP
def compute_ap(recall, precision):
    """ Compute the average precision, given the recall and precision curves
    # Arguments
        recall:    The recall curve (list)
        precision: The precision curve (list)
    # Returns
        Average precision, precision curve, recall curve
    """

    # Append sentinel values to beginning and end 将开区间给补上,补成闭合的区间。
    mrec = np.concatenate(([0.0], recall, [1.0]))
    mpre = np.concatenate(([1.0], precision, [0.0]))

    # Compute the precision envelope
    """
    人为的把PR曲线变成单调递减的,例如:
    np.maximum(accumulate(np.array([21, 23, 18, 19, 20, 13, 12, 11]) ) => np.array([23, 23, 20, 20, 20, 13, 12, 11])
    """
    mpre = np.flip(np.maximum.accumulate(np.flip(mpre)))

    # Integrate area under curve
    method = 'interp'  # methods: 'continuous', 'interp'
    if method == 'interp': # 默认采用 interpolated-precision 曲线,
        x = np.linspace(0, 1, 101)  # 101-point interp (COCO)
        ap = np.trapz(np.interp(x, mrec, mpre), x)  # integrate
    else:  # 'continuous'
        i = np.where(mrec[1:] != mrec[:-1])[0]  # points where x axis (recall) changes
        ap = np.sum((mrec[i + 1] - mrec[i]) * mpre[i + 1])  # area under curve

    return ap, mpre, mrec
计算每个类别的AP(Average Precision):
- 对检测框按照置信度从高到低排序。
- 计算不同置信度阈值下的精确率和召回率。
- 绘制PR(Precision-Recall)曲线,计算曲线下的面积即为AP。
计算所有类别的AP的平均值,即为mAP。
数据处理的格式
ground_truth = [
    {'image_id': 1, 'class_id': 0, 'bbox': [x1, y1, x2, y2]},
    {'image_id': 1, 'class_id': 1, 'bbox': [x1, y1, x2, y2]},
    ...
]

predictions = [
    {'image_id': 1, 'class_id': 0, 'bbox': [x1, y1, x2, y2], 'confidence': 0.9},
    {'image_id': 1, 'class_id': 1, 'bbox': [x1, y1, x2, y2], 'confidence': 0.8},
    ...
]
计算 recall 和 precision
import numpy as np

def calculate_iou(box1, box2):
    x1, y1, x2, y2 = box1
    x1_p, y1_p, x2_p, y2_p = box2

    xi1 = max(x1, x1_p)
    yi1 = max(y1, y1_p)
    xi2 = min(x2, x2_p)
    yi2 = min(y2, y2_p)

    inter_area = max(xi2 - xi1, 0) * max(yi2 - yi1, 0)

    box1_area = (x2 - x1) * (y2 - y1)
    box2_area = (x2_p - x1_p) * (y2_p - y1_p)

    union_area = box1_area + box2_area - inter_area

    iou = inter_area / union_area
    return iou

def calculate_precision_recall(ground_truth, predictions, iou_threshold=0.5):
    true_positives = []
    false_positives = []
    false_negatives = []

    for pred in predictions:
        image_id = pred['image_id']
        class_id = pred['class_id']
        bbox = pred['bbox']
        confidence = pred['confidence']

        matched = False
        for gt in ground_truth:
            if (gt['image_id'] == image_id and gt['class_id'] == class_id and
                    calculate_iou(gt['bbox'], bbox) >= iou_threshold):
                matched = True
                break

        if matched:
            true_positives.append(confidence)
        else:
            false_positives.append(confidence)

    for gt in ground_truth:
        image_id = gt['image_id']
        class_id = gt['class_id']
        bbox = gt['bbox']

        matched = False
        for pred in predictions:
            if (pred['image_id'] == image_id and pred['class_id'] == class_id and
                    calculate_iou(gt['bbox'], pred['bbox']) >= iou_threshold):
                matched = True
                break

        if not matched:
            false_negatives.append(gt)

    true_positives.sort(reverse=True)
    false_positives.sort(reverse=True)

    precision = []
    recall = []
    tp = 0
    fp = 0
    fn = len(false_negatives)

    for tp_val in true_positives:
        tp += 1
        precision.append(tp / (tp + fp))
        recall.append(tp / (tp + fn))

    for fp_val in false_positives:
        fp += 1
        precision.append(tp / (tp + fp))
        recall.append(tp / (tp + fn))

    return precision, recall
计算 map50
def calculate_ap(precision, recall):
    mrec = np.concatenate(([0.], recall, [1.]))
    mpre = np.concatenate(([0.], precision, [0.]))

    for i in range(len(mpre) - 2, -1, -1):
        mpre[i] = max(mpre[i], mpre[i + 1])

    i = np.where(mrec[1:] != mrec[:-1])[0]
    ap = np.sum((mrec[i + 1] - mrec[i]) * mpre[i + 1])
    return ap

def calculate_map(ground_truth, predictions, iou_threshold=0.5):
    class_ids = set([gt['class_id'] for gt in ground_truth])
    map_score = 0.0

    for class_id in class_ids:
        gt_class = [gt for gt in ground_truth if gt['class_id'] == class_id]
        pred_class = [pred for pred in predictions if pred['class_id'] == class_id]

        precision, recall = calculate_precision_recall(gt_class, pred_class, iou_threshold)
        ap = calculate_ap(precision, recall)
        map_score += ap

    map_score /= len(class_ids)
    return map_score

# Example usage
map_score = calculate_map(ground_truth, predictions)
print(f"mAP score: {map_score}")
计算 map 的话,修改 def calculate_map(ground_truth, predictions, iou_threshold=0.5): 的阈值即可,0.50~0.95,间隔为 0.05


 2万+
2万+

 被折叠的 条评论
为什么被折叠?
被折叠的 条评论
为什么被折叠?
 到【灌水乐园】发言


