


面向初学者讲解ROOT直方图基本功能
1.直方图的创建和数据导入
直方图的常用定义方法 ,参考ROOT:TH1 Class Reference
TH1::TH1
(
const char * 	name,//直方图的名字,很重要,不能重复
const char * 	title,//直方图的标题,直接体现在图像中
Int_t 	nbins,//bin的数目
Double_t 	xlow,//x轴的下限
Double_t 	xup
)
画直方图的简单例子
TCanvas *c = new TCanvas();//创建画板

TH1 *h1 = new TH1F("h1","Gaus_10000",100,-5,5);
h1->FillRandom("gaus",10000);

h1->Draw();
c->Draw();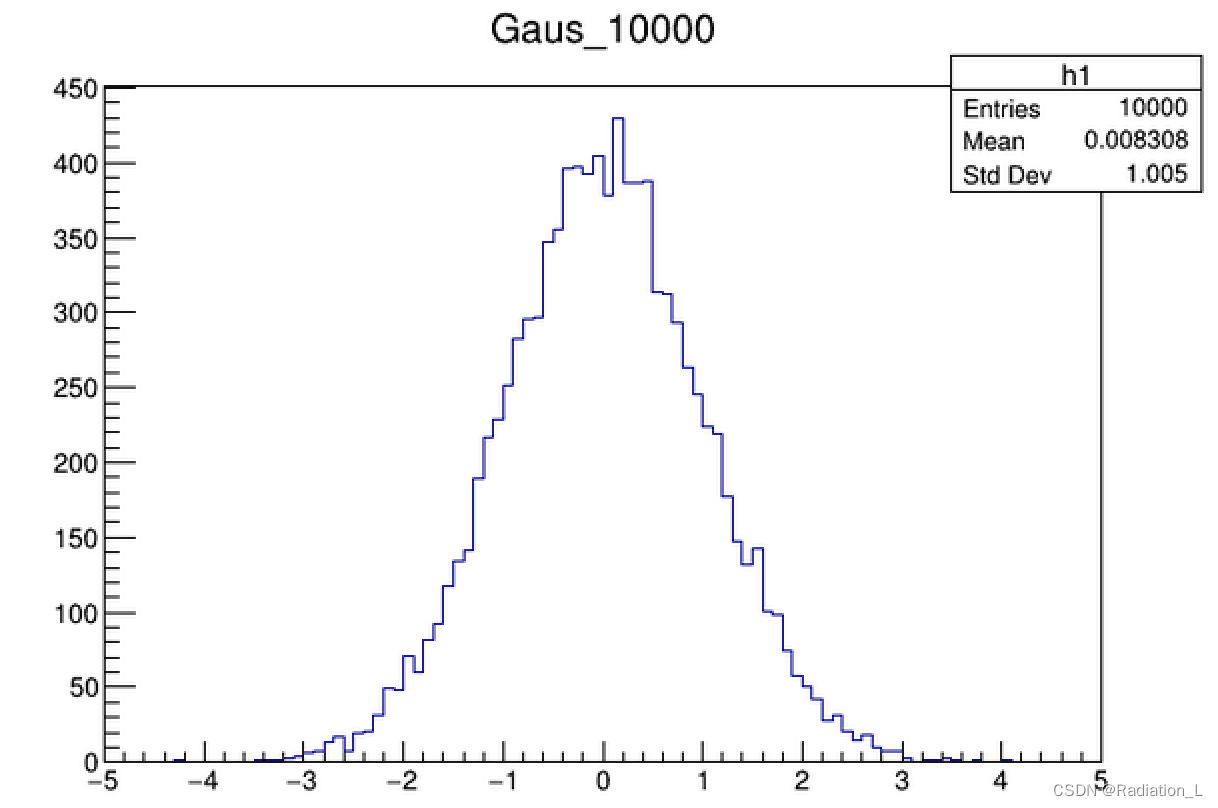
直方图数据的填充
几个常用的函数。
TH1::Fill	(	Double_t 	x	)
//填入一个数据,值为x,计数为1

void TH1::FillRandom
(
const char * 	fname,//函数名
Int_t 	ntimes = 5000,//个数
TRandom * 	rng = nullptr//ROOT中的随机数(可以先不管)
)
//fname可以是在ROOT中定义的基本函数,也可以是一个函数(TF1)
FillRandom的使用
TCanvas *c = new TCanvas();

TH1 *h1 = new TH1F("h1","Fill",100,-5,5);
TF1 *f  = new TF1("f","x*x");

h1->FillRandom("f",1000);

h1->Draw();
c->Draw(); 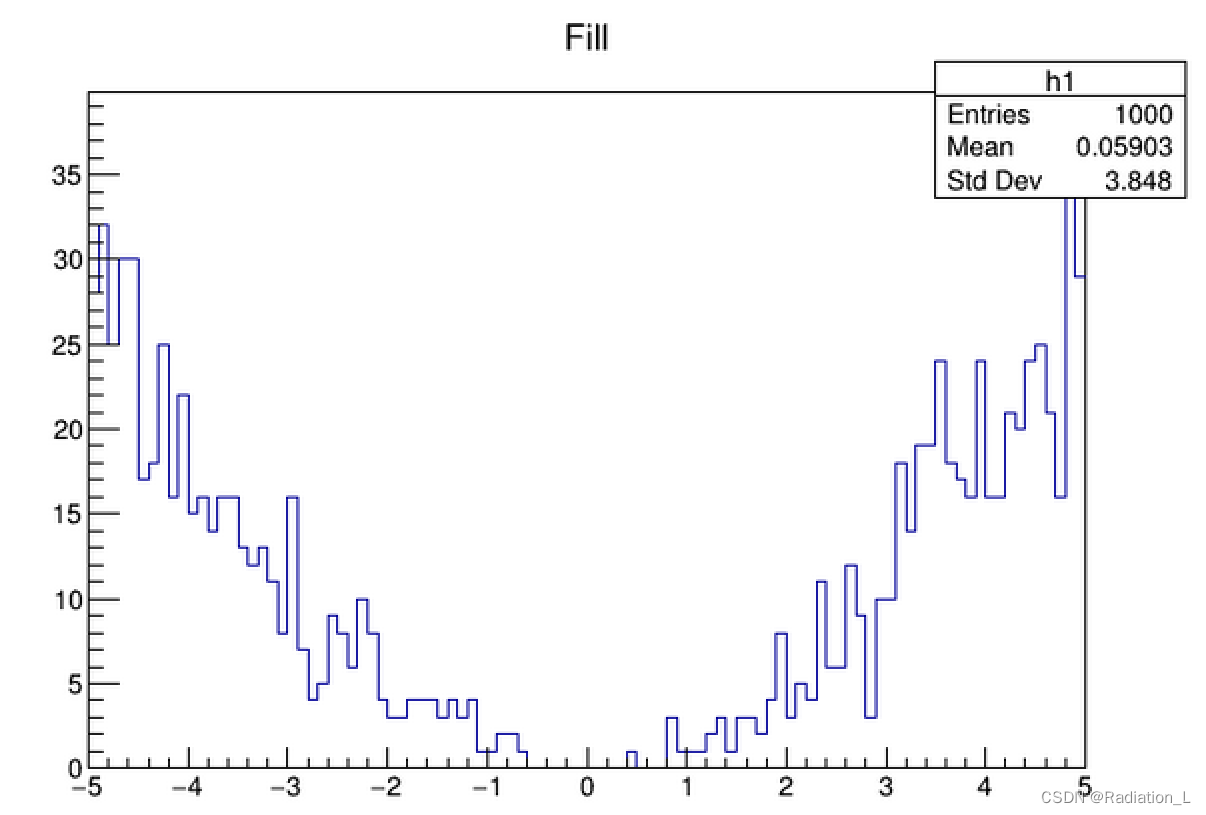
需要注意的是,在此处导入的fname首先被转化为pdf再进行抽样。也就意味着这个函数的积分必须不为0,意味着很多函数都不能进行抽样。所以需要在某函数中抽样时一般采用下面的方法——TF1::GetRandom():
TCanvas *c = new TCanvas();

TH1 *h1 = new TH1F("h1","Fill",100,0,5);
TF1 *f = new TF1("f","2*x+5",0,5);
double x;

for (int i=0;i<10000;i++)
{
    x=f->GetRandom();
    h1->Fill(x);
}

h1->Draw();
c->Draw(); 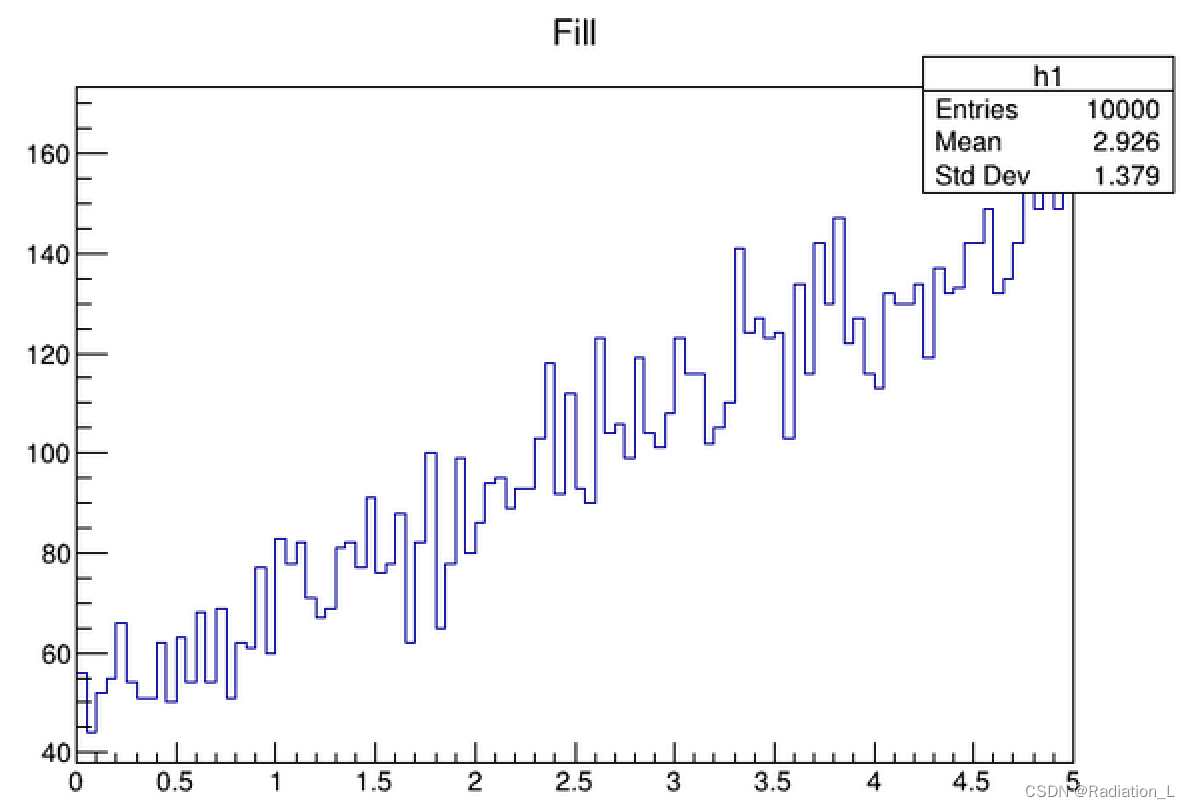
2.直方图的样式(画图)
以Gauss_10000(本篇文章第一个图)举例。
TCanvas *c = new TCanvas();

TH1 *h1 = new TH1F("h1","Gaus_10000",100,-5,5);
h1->FillRandom("gaus",10000);

h1->SetAxisRange(-2,2,"x");
h1->SetMinimum(50);

h1->SetXTitle("E");//坐标轴标题
h1->SetYTitle("N");

h1->SetLineColor(1);//线属性
h1->SetLineWidth(2);
h1->SetFillColor(23);//填充属性

h1->SetMarkerStyle(8);//Marker的样式

h1->Draw();
h1->Draw("E1 same");

c->Draw();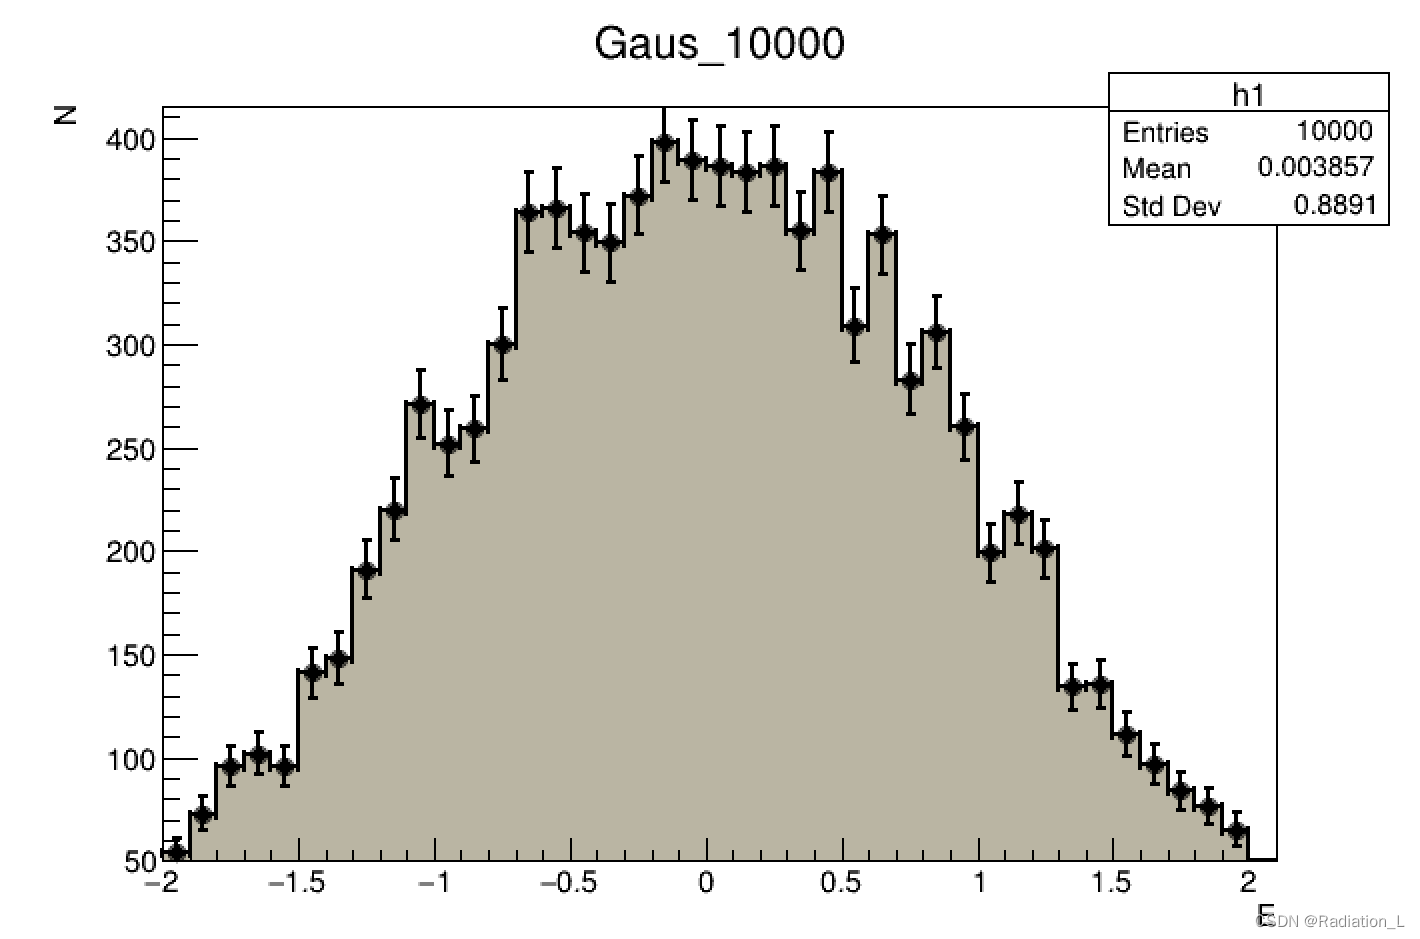
参考ROOT官网TH1,查看坐标轴和标题的操作,参考TAttLine,TAttFill,TAttMarker,查看颜色和数据点的样式。需要注意“same”命令的使用,可以在同一个画布上画出多张直方图。
Draw的选项参照THistPainter
图像的数据展示
使用gSytle,按照给定的选项(开关)展示直方图的数据,参考TPaveStats
gStyle->SetOptStat(mode);

mode = ksiourmen  (default = 000001111)
k = 1;  kurtosis printed
k = 2;  kurtosis and kurtosis error printed
s = 1;  skewness printed
s = 2;  skewness and skewness error printed
i = 1;  integral of bins printed
i = 2;  integral of bins with option "width" printed
o = 1;  number of overflows printed
u = 1;  number of underflows printed
r = 1;  standard deviation printed
r = 2;  standard deviation and standard deviation error printed
m = 1;  mean value printed
m = 2;  mean and mean error values printed
e = 1;  number of entries printed
n = 1; name of histogram is printed参考TLegend给出图例:
当不需要自定义Legend的时候,可以试试 c1->BuildLegend();
TCanvas *c1 = new TCanvas();

TH1 *h1 = new TH1F("h1","Gaus_10000",100,-5,5);
h1->FillRandom("gaus",10000);

TH1 *h2 = new TH1F("h2","Gaus_5000",100,-5,5);
h2->FillRandom("gaus",5000);

TH1 *h3 = new TH1F("h3","Gaus_10000+Gaus_5000",100,-5,5);
h3->Sumw2();
h3->Add(h1,h2,1,1);
h3->SetLineColor(6);

h1->SetLineColor(2);
h2->SetLineColor(4);

//Statistics box editing
//***************************
h3->Draw();
h1->Draw("sames");
h2->Draw("sames");
h3->Draw("sames");
c1->Update();

gStyle->SetOptStat(1110);

TPaveStats *ps = (TPaveStats*)h3->FindObject("stats");

ps->SetName("mystats");
TList *listOfLines = ps->GetListOfLines();

TLatex *myt = new TLatex(0,0,"Test = 10");
myt ->SetTextFont(42);
myt ->SetTextSize(0.03);
myt ->SetTextColor(kRed);
listOfLines->Add(myt);

//try:remove Mean
/*
TText *tconst = ps->GetLineWith("Mean");
listOfLines->Remove(tconst);
*/

h3->SetStats(0);
c1->Modified();
//***************************

auto legend = new TLegend(0.1,0.7,0.3,0.9);
legend->SetHeader("The Legend Title","C"); // option "C" allows to center the header
legend->AddEntry(h1,"Gauss 1","l");
legend->AddEntry(h2,"Gauss 2","l");
legend->AddEntry(h3,"Gauss 3","l");
legend->Draw();

c1->Draw();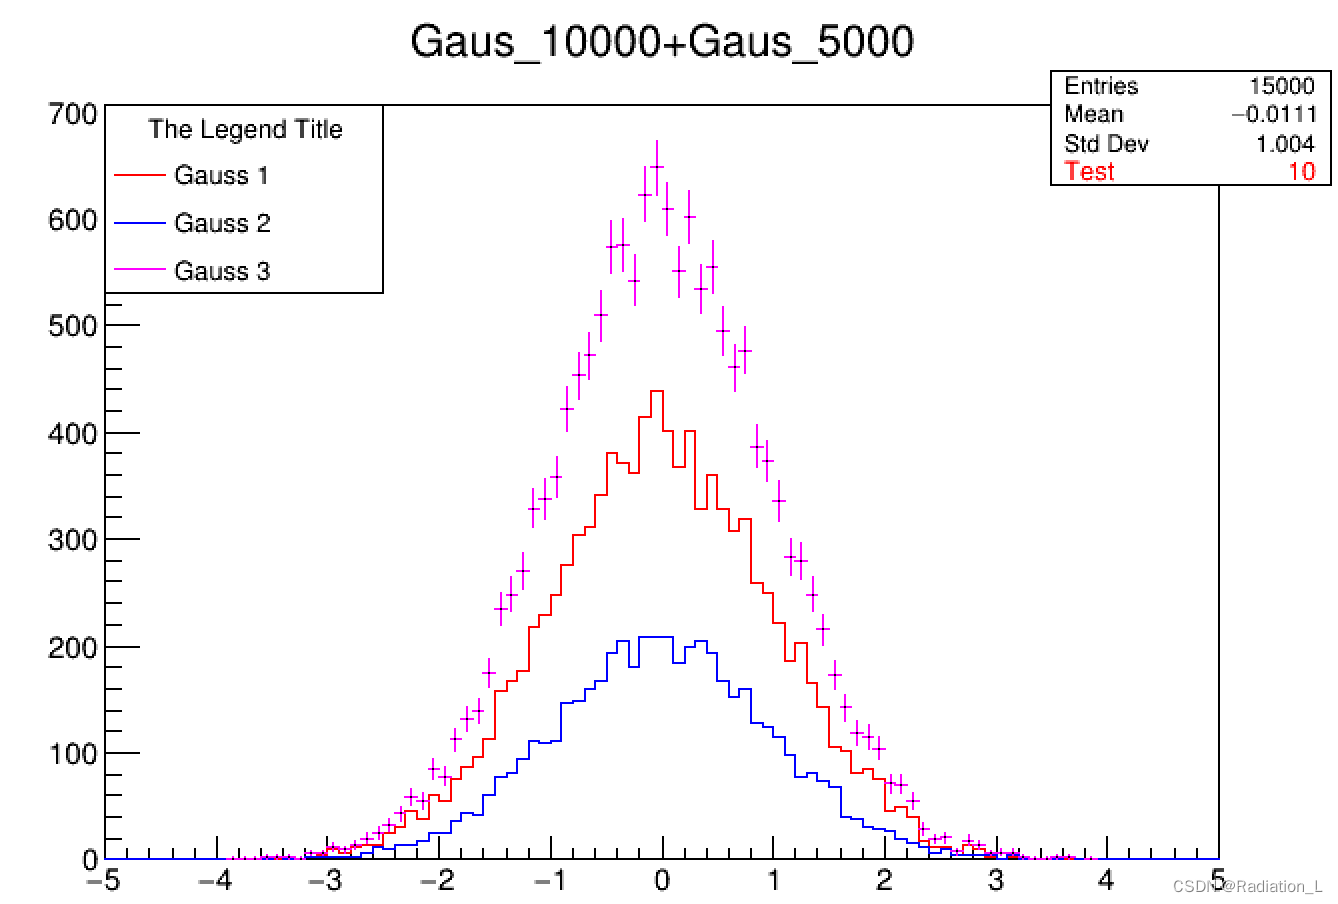
!使用 %jsroot on 可以对图型做很多调整,学会利用,减少工作量
3.直方图数据获取
轴与Bin相关的数据获取,TAxis类。
查询某个Bin的上下边界(输入Bin数),查询某个数据在第几个Bin中(输入x)
//在Gauss_10000图中
TAxis * axis = h1->GetXaxis();

double n,n1,n2;

n = axis->GetNbins();

n1 = axis->GetBinLowEdge(50);//第50个Bin的左边界
n2 = axis->GetBinUpEdge(50);//第50个Bin的右边界
n3 = axis->FindBin(0.);//0所在的Bin是第几个

cout<<n1<<endl<<n2<<endl<<n3;

结果:
>>-0.1
>>0
>>51 计数和误差的数据获取,默认的误差为(由泊松分布决定)
//同样在Gauss_10000中
n1 = h1->GetBinContent(50);//得到Bin中的计数
n2 = h1->GetBinError(50);//得到Bin的误差

cout<<n1<<endl<<n2<<endl;

结果:
>>396
>>19.8997
4.直方图数据处理
直方图的相加和相减(Add),还可以使用THStack
直方图的相乘和相除(Multiply,Divide)
注意在归一化和加减乘除中,要正确得到统计误差,需要调用: TH1::SetDefaultSumw2();或对每个直方图(如his)调用 his->Sumw2();否则只会得到由计数绝对的默认误差。
TCanvas *c1 = new TCanvas();

TH1 *h1 = new TH1F("h1","Gaus_10000",100,-5,5);
h1->FillRandom("gaus",10000);

TH1 *h2 = new TH1F("h2","Gaus_1000",100,-5,5);
h2->FillRandom("gaus",1000);

h1->SetLineColor(1);
h2->SetLineColor(2);

TH1 *h3 = new TH1F("h3","h1+h2",100,-5,5);
h3->Sumw2();
h3->Add(h1,h2,1,1);
h3->SetLineColor(3);

TH1 *h4 = new TH1F("h4","h1*h2",100,-5,5);
TH1 *h5 = new TH1F("h5","h1/h2",100,-5,5);
h4->Sumw2();
h5->Sumw2();
h4->SetLineColor(4);
h5->SetLineColor(6);
h4->Multiply(h1,h2,1,1);
h5->Divide(h1,h2,1,1);

c1->Divide(2,2);

//original
c1->cd(1);
h1->Draw();
h2->Draw("same");

c1->cd(2);
h3->Draw();
h2->Draw("same");
h1->Draw("same");

c1->cd(3);
h4->Draw();
h2->Draw("same");
h1->Draw("same");

c1->cd(4);
h5->Draw();
h2->Draw("same");
h1->Draw("same");

c1->Draw();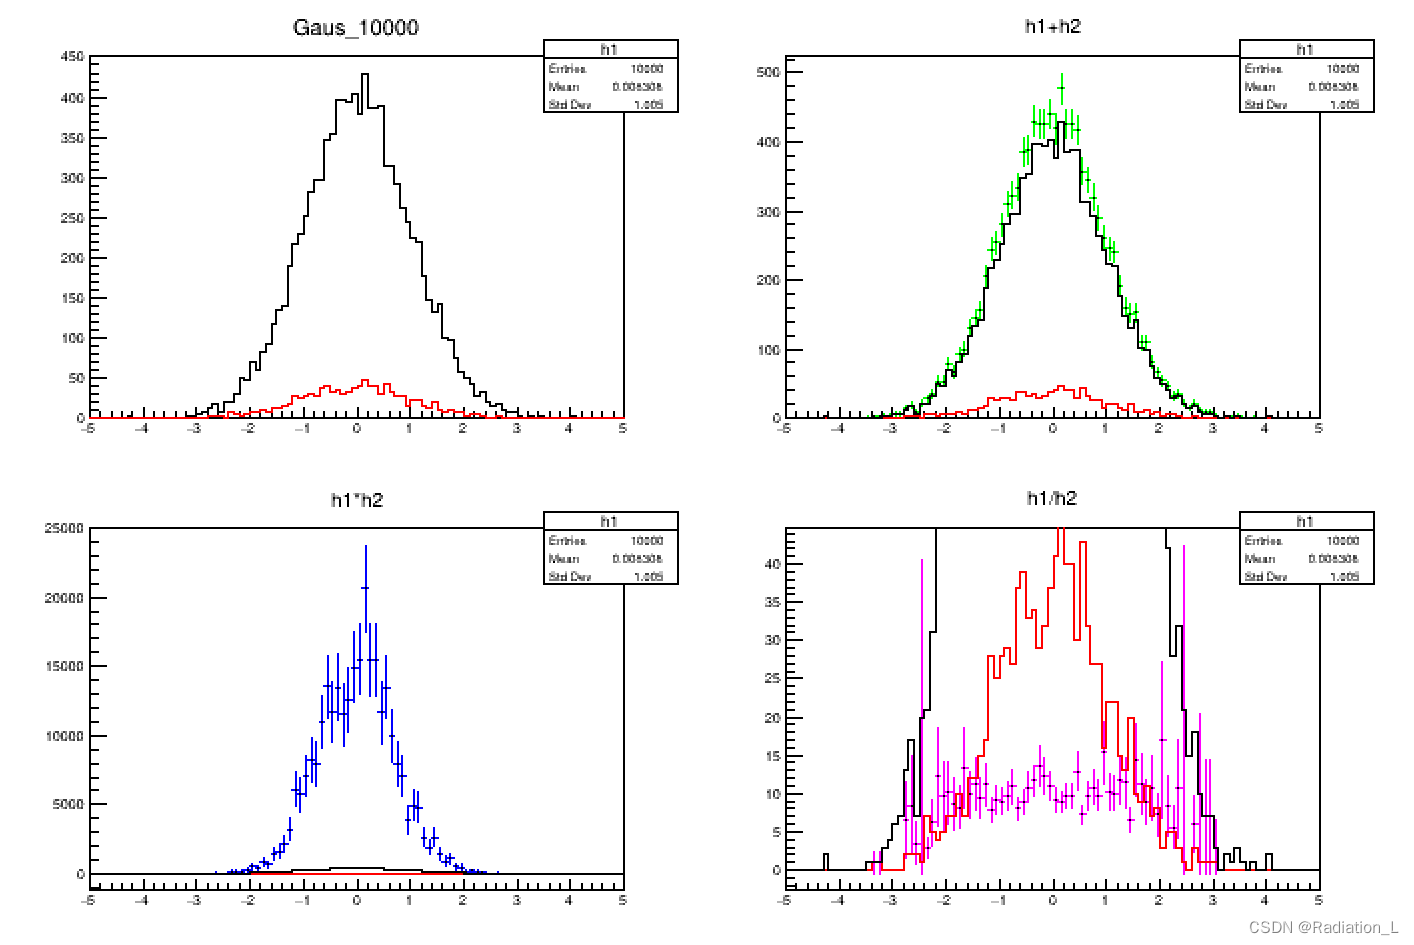
直方图的归一化(normalization)
归一化到同一积分可直观比较两种分布之间的差别;可直观估计概率密度函数
TCanvas *c = new TCanvas();//创建画板

TH1 *h1 = new TH1F("h1","Gaus_10000",100,-5,5);
h1->FillRandom("gaus",10000);

h1->DrawNormalized("e", 1);

c->Draw();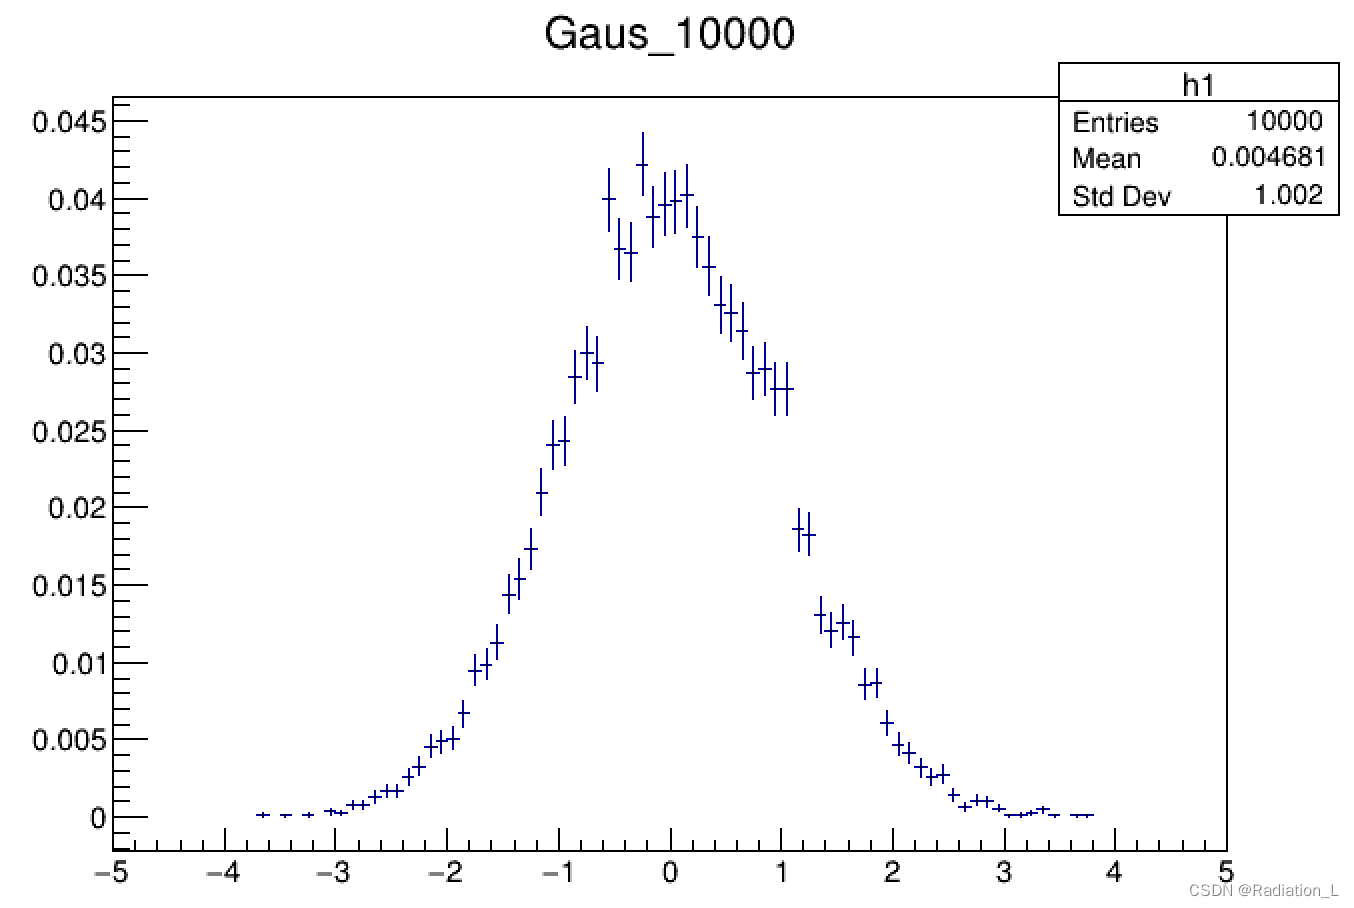


 553
553

 被折叠的 条评论
为什么被折叠?
被折叠的 条评论
为什么被折叠?
 到【灌水乐园】发言


