


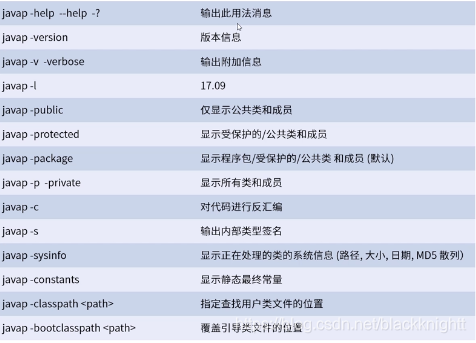
javap
java反编译工具,主要用于根据java字节码文件反汇编为Java源代码文件
javap <option> <classes>
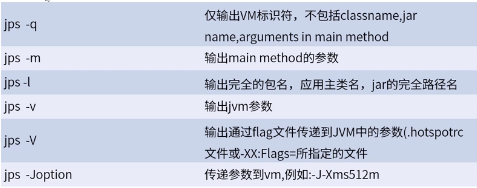
jps
Java Virtual Machine Process Status Tool
显示当前所有java进程pid的命令
jps <options> <hostid>
执行效果:
F:\demo_car>jps
11460 KotlinCompileDaemon
15412 Launcher
7604 DemoApplication
12600
14952 Jps

F:\demo_car>jps -help
usage: jps [-help]
       jps [-q] [-mlvV] [<hostid>]

Definitions:
    <hostid>:      <hostname>[:<port>]

F:\demo_car>jps -mlvV
2448 sun.tools.jps.Jps -mlvV -Dapplication.home=D:\Program Files\Java\jdk1.8.0_74 -Xms8m
11460 org.jetbrains.kotlin.daemon.KotlinCompileDaemon --daemon-runFilesPath C:\Users\caijie\AppData\Local\kotlin\daemon --daemon-autoshutdownIdleSeconds=7200 --daemon-compilerClasspath C:\Program Files\JetBrains\IntelliJ IDEA 2019.1.1\plugins\Ko
tlin\kotlinc\lib\kotlin-compiler.jar;D:\Program Files\Java\jdk1.8.0_74\lib\tools.jar -Djava.awt.headless=true -Djava.rmi.server.hostname=127.0.0.1 -Xmx700m -Dkotlin.incremental.compilation=true -Dkotlin.incremental.compilation.js=true
15412 org.jetbrains.jps.cmdline.Launcher C:/Program Files/JetBrains/IntelliJ IDEA 2019.1.1/lib/forms-1.1-preview.jar;C:/Program Files/JetBrains/IntelliJ IDEA 2019.1.1/lib/aether-transport-file-1.1.0.jar;C:/Program Files/JetBrains/IntelliJ IDEA 2
019.1.1/lib/platform-api.jar;C:/Program Files/JetBrains/IntelliJ IDEA 2019.1.1/lib/netty-resolver-4.1.32.Final.jar;C:/Program Files/JetBrains/IntelliJ IDEA 2019.1.1/lib/netty-transport-4.1.32.Final.jar;C:/Program Files/JetBrains/IntelliJ IDEA 20
19.1.1/lib/forms_rt.jar;C:/Program Files/JetBrains/IntelliJ IDEA 2019.1.1/lib/maven-repository-metadata-3.3.9.jar;C:/Program Files/JetBrains/IntelliJ IDEA 2019.1.1/lib/httpcore-4.4.10.jar;C:/Program Files/JetBrains/IntelliJ IDEA 2019.1.1/lib/slf
4j-api-1.7.25.jar;C:/Program Files/JetBrains/IntelliJ IDEA 2019.1.1/lib/jps-model.jar;C:/Program Files/JetBrains/IntelliJ IDEA 2019.1.1/lib/nanoxml-2.2.3.jar;C:/Program Files/JetBrains/IntelliJ IDEA 2019.1.1/lib/oro-2.0.8.jar;C:/Program Files/Je
tBrains/IntelliJ IDEA 2019.1.1/lib/trove4j.jar;C:/ -Xmx700m -Djava.awt.headless=true -Djava.endorsed.dirs="" -Djdt.compiler.useSingleThread=true -Dpreload.project.path=F:/demo_car -Dpreload.config.path=C:/Users/caijie/.IntelliJIdea2019.1/config/
options -Dcompile.parallel=false -Drebuild.on.dependency.change=true -Djava.net.preferIPv4Stack=true -Dio.netty.initialSeedUniquifier=9063978992772447276 -Dfile.encoding=GBK -Duser.language=zh -Duser.country=CN -Didea.paths.selector=IntelliJIdea
2019.1 -Didea.home.path=C:\Program Files\JetBrains\IntelliJ IDEA 2019.1.1 -Didea.config.path=C:\Users\caijie\.IntelliJIdea2019.1\config -Didea.plugins.path=C:\Users\caijie\.IntelliJIdea2019.1\config\plugins -Djps.log.dir=C:/Users/caijie/.Intelli
JIdea2019.1/system/log/build-log -Djps.fallback.jdk.home=C:/Program Files/JetBrains/IntelliJ IDEA 2019.1.1/jre64 -Djps.fallback.jdk.version=1.8.0_202-release -Dio.netty.noUnsafe=true -Djava.io.tmpdir=C:/Users/caijie/.IntelliJIdea2019.1/system/co
mpile-server/demo_car_26c202e9/_temp_ -Djps.backward.ref.index.builder=true -Dkotlin.incrementa
7604 com.example.demo.DemoApplication -agentlib:jdwp=transport=dt_socket,address=127.0.0.1:57259,suspend=y,server=n -javaagent:C:\Users\caijie\.IntelliJIdea2019.1\system\captureAgent\debugger-agent.jar -Dfile.encoding=UTF-8
12600  -Xms128m -Xmx750m -XX:ReservedCodeCacheSize=240m -XX:+UseConcMarkSweepGC -XX:SoftRefLRUPolicyMSPerMB=50 -ea -Dsun.io.useCanonCaches=false -Djava.net.preferIPv4Stack=true -Djdk.http.auth.tunneling.disabledSchemes="" -XX:+HeapDumpOnOutOfMem
oryError -XX:-OmitStackTraceInFastThrow -Djb.vmOptionsFile=C:\Program Files\JetBrains\IntelliJ IDEA 2019.1.1\bin\idea64.exe.vmoptions -Didea.jre.check=true -Dide.native.launcher=true -Didea.paths.selector=IntelliJIdea2019.1 -XX:ErrorFile=C:\User
s\caijie\java_error_in_idea_%p.log -XX:HeapDumpPath=C:\Users\caijie\java_error_in_idea.hprof

F:\demo_car>jps -q -mlvV
11460
15412
7604
12600
5308
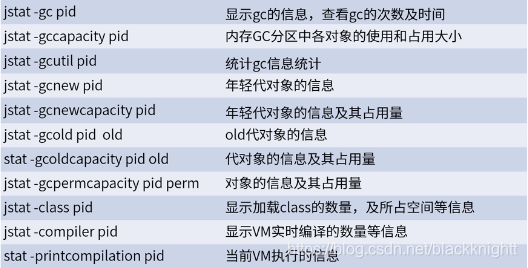
jstat
jstat监视java虚拟机(JVM)统计信息
用法:
jstat [generalOption|outputOptions vmid [interval [s|ms] [count]]]
-t 参数 可以在输出信息前面加一个Timestamp列,显示程序运行的时间。
-h参数 可以在周期性的数据输出时,输出多少行数据后,跟着输出一个表头信息
interval 指定输出统计周期
count 指定输出多少次数据。
执行效果:
先通过jps获取虚拟机的进程号
F:\demo_car>jps
6992 Jps
11460 KotlinCompileDaemon
15412 Launcher
7604 DemoApplication
12600
查看进程号为7604的jvm统计信息
F:\demo_car>jstat -class 7604
Loaded  Bytes  Unloaded  Bytes     Time
  8134 15002.4        1     0.9       6.74
F:\demo_car>jstat -gc 7604
 S0C    S1C    S0U    S1U      EC       EU        OC         OU       MC     MU    CCSC   CCSU   YGC     YGCT    FGC    FGCT     GCT
14336.0 14848.0  0.0   6876.7 171008.0 121213.5  144896.0   15717.8   40704.0 39044.0 5120.0 4820.4      7    0.064   2      0.078    0.141
各个参数的含义参考
[jstat命令查看jvm的GC情况 (以Linux为例)](https://www.cnblogs.com/yjd_hycf_space/p/7755633.html)

stat常用于实时统计jvm信息,可以使用如下命令,1000代表每1000毫秒刷新一次,-h10表示每10行出现1次表头
F:\demo_car>jstat -gc -h10  7604 1000
 S0C    S1C    S0U    S1U      EC       EU        OC         OU       MC     MU    CCSC   CCSU   YGC     YGCT    FGC    FGCT     GCT
14336.0 14848.0  0.0   6876.7 171008.0 121213.5  144896.0   15717.8   40704.0 39044.0 5120.0 4820.4      7    0.064   2      0.078    0.141
14336.0 14848.0  0.0   6876.7 171008.0 121213.5  144896.0   15717.8   40704.0 39044.0 5120.0 4820.4      7    0.064   2      0.078    0.141
14336.0 14848.0  0.0   6876.7 171008.0 121213.5  144896.0   15717.8   40704.0 39044.0 5120.0 4820.4      7    0.064   2      0.078    0.141
14336.0 14848.0  0.0   6876.7 171008.0 121213.5  144896.0   15717.8   40704.0 39044.0 5120.0 4820.4      7    0.064   2      0.078    0.141
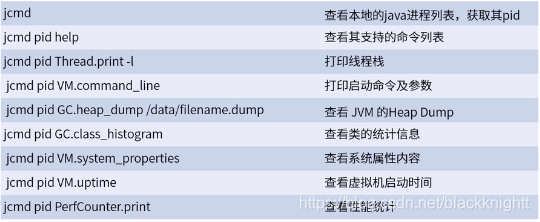
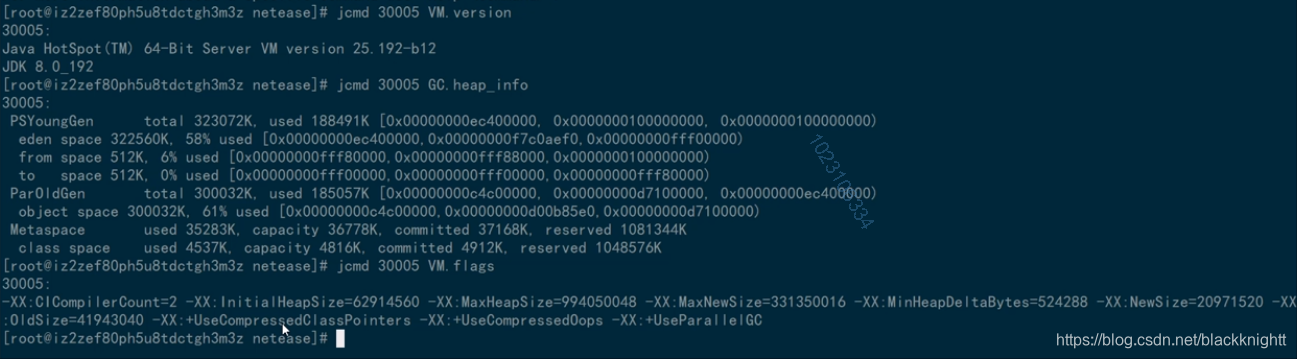
jcmd
jcmd工具,可以替代jps工具查看本地的jvm信息
jcmd -l
jcmd <pid|main class> <command...|perfCounter.print|-f file>
执行效果:
F:\demo_car>jcmd
9296 sun.tools.jcmd.JCmd
11460 org.jetbrains.kotlin.daemon.KotlinCompileDaemon --daemon-runFilesPath C:\Users\caijie\AppData\Local\kotlin\daemon --daemon-autoshutdownIdleSeconds=7200 --daemon-compilerClasspath C:\Program Files\JetBrains\IntelliJ IDEA 2019.1.1\plugins\Ko
tlin\kotlinc\lib\kotlin-compiler.jar;D:\Program Files\Java\jdk1.8.0_74\lib\tools.jar
15412 org.jetbrains.jps.cmdline.Launcher C:/Program Files/JetBrains/IntelliJ IDEA 2019.1.1/lib/forms-1.1-preview.jar;C:/Program Files/JetBrains/IntelliJ IDEA 2019.1.1/lib/aether-transport-file-1.1.0.jar;C:/Program Files/JetBrains/IntelliJ IDEA 2
019.1.1/lib/platform-api.jar;C:/Program Files/JetBrains/IntelliJ IDEA 2019.1.1/lib/netty-resolver-4.1.32.Final.jar;C:/Program Files/JetBrains/IntelliJ IDEA 2019.1.1/lib/netty-transport-4.1.32.Final.jar;C:/Program Files/JetBrains/IntelliJ IDEA 20
19.1.1/lib/forms_rt.jar;C:/Program Files/JetBrains/IntelliJ IDEA 2019.1.1/lib/maven-repository-metadata-3.3.9.jar;C:/Program Files/JetBrains/IntelliJ IDEA 2019.1.1/lib/httpcore-4.4.10.jar;C:/Program Files/JetBrains/IntelliJ IDEA 2019.1.1/lib/slf
4j-api-1.7.25.jar;C:/Program Files/JetBrains/IntelliJ IDEA 2019.1.1/lib/jps-model.jar;C:/Program Files/JetBrains/IntelliJ IDEA 2019.1.1/lib/nanoxml-2.2.3.jar;C:/Program Files/JetBrains/IntelliJ IDEA 2019.1.1/lib/oro-2.0.8.jar;C:/Program Files/Je
tBrains/IntelliJ IDEA 2019.1.1/lib/trove4j.jar;C:/
7604 com.example.demo.DemoApplication
12600

F:\demo_car>jcmd 7604 help
7604:
The following commands are available:
JFR.stop
JFR.start
JFR.dump
JFR.check
VM.native_memory
VM.check_commercial_features
VM.unlock_commercial_features
ManagementAgent.stop
ManagementAgent.start_local
ManagementAgent.start
GC.rotate_log
Thread.print
GC.class_stats
GC.class_histogram
GC.heap_dump
GC.run_finalization
GC.run
VM.uptime
VM.flags
VM.system_properties
VM.command_line
VM.version
help
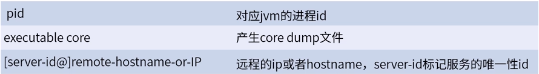
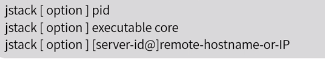
jinfo
jinfo可以查看运行中jvm的全部参数,还可以设置部分参数
jinfo [option] pid
jinfo [option] executable core
jinfo [option] [server-id@] remote-hostname-or-IP
执行效果:
F:\demo_car>jinfo 7604
Attaching to process ID 7604, please wait...
Debugger attached successfully.
Server compiler detected.
JVM version is 25.74-b02
Java System Properties:

java.runtime.name = Java(TM) SE Runtime Environment
java.vm.version = 25.74-b02
sun.boot.library.path = D:\Program Files\Java\jdk1.8.0_74\jre\bin
java.vendor.url = http://java.oracle.com/
java.vm.vendor = Oracle Corporation
path.separator = ;
......
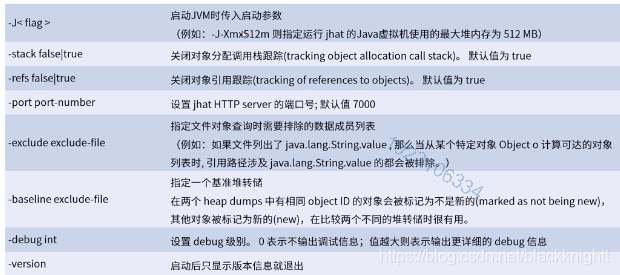
jhat
Java Head Analyse Tool分析java堆的命令,可以将堆中的对象以html的形式显示出来,支持对象查询语言OQL

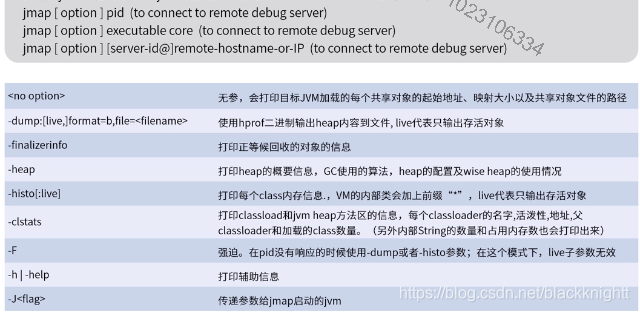
jmap
打印出java进程内存中Object的情况。或者将JVM中的堆,以二进制输出成文件
执行效果:
F:\demo_car>jmap -help
Usage:
    jmap [option] <pid>
        (to connect to running process)
    jmap [option] <executable <core>
        (to connect to a core file)
    jmap [option] [server_id@]<remote server IP or hostname>
        (to connect to remote debug server)

where <option> is one of:
    <none>               to print same info as Solaris pmap
    -heap                to print java heap summary
    -histo[:live]        to print histogram of java object heap; if the "live"
                         suboption is specified, only count live objects
    -clstats             to print class loader statistics
    -finalizerinfo       to print information on objects awaiting finalization
    -dump:<dump-options> to dump java heap in hprof binary format
                         dump-options:
                           live         dump only live objects; if not specified,
                                        all objects in the heap are dumped.
                           format=b     binary format
                           file=<file>  dump heap to <file>
                         Example: jmap -dump:live,format=b,file=heap.bin <pid>
    -F                   force. Use with -dump:<dump-options> <pid> or -histo
                         to force a heap dump or histogram when <pid> does not
                         respond. The "live" suboption is not supported
                         in this mode.
    -h | -help           to print this help message
    -J<flag>             to pass <flag> directly to the runtime system


F:\demo_car>jmap -heap 7604
Attaching to process ID 7604, please wait...
Debugger attached successfully.
Server compiler detected.
JVM version is 25.74-b02

using thread-local object allocation.
Parallel GC with 8 thread(s)

Heap Configuration:
   MinHeapFreeRatio         = 0
   MaxHeapFreeRatio         = 100
   MaxHeapSize              = 4253024256 (4056.0MB)
   NewSize                  = 88604672 (84.5MB)
   MaxNewSize               = 1417674752 (1352.0MB)
   OldSize                  = 177733632 (169.5MB)
   NewRatio                 = 2
   SurvivorRatio            = 8
   MetaspaceSize            = 21807104 (20.796875MB)
   CompressedClassSpaceSize = 1073741824 (1024.0MB)
   MaxMetaspaceSize         = 17592186044415 MB
   G1HeapRegionSize         = 0 (0.0MB)

Heap Usage:
PS Young Generation
Eden Space:
   capacity = 175112192 (167.0MB)
   used     = 128208624 (122.26927185058594MB)
   free     = 46903568 (44.73072814941406MB)
   73.21513284466224% used
From Space:
   capacity = 15204352 (14.5MB)
   used     = 7041720 (6.715507507324219MB)
   free     = 8162632 (7.784492492675781MB)
   46.31384487809806% used
To Space:
   capacity = 14680064 (14.0MB)
   used     = 0 (0.0MB)
   free     = 14680064 (14.0MB)
   0.0% used
PS Old Generation
   capacity = 148373504 (141.5MB)
   used     = 16095032 (15.349418640136719MB)
   free     = 132278472 (126.15058135986328MB)
   10.84764568207542% used

20244 interned Strings occupying 1906064 bytes.
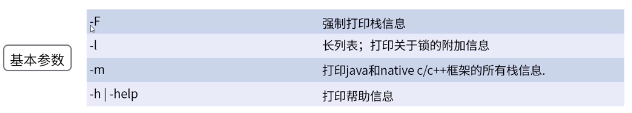
jstack
堆栈跟踪工具。jstack用于打印出给定的java进程ID或core file或远程调试服务的java堆栈信息,如果是在64位机器上,需要制定选项"-J-d64"
一般在死锁或者是CPU100%的时候,会使用该命令

执行效果:
F:\demo_car>jstack 7604
2019-10-26 17:31:32
Full thread dump Java HotSpot(TM) 64-Bit Server VM (25.74-b02 mixed mode):

"DestroyJavaVM" #37 prio=5 os_prio=0 tid=0x00000000244e5800 nid=0x3458 waiting on condition [0x0000000000000000]
   java.lang.Thread.State: RUNNABLE

"http-nio-8080-Acceptor" #35 daemon prio=5 os_prio=0 tid=0x00000000244e5000 nid=0x2cd8 runnable [0x000000002f3af000]
   java.lang.Thread.State: RUNNABLE
        at sun.nio.ch.ServerSocketChannelImpl.accept0(Native Method)
        at sun.nio.ch.ServerSocketChannelImpl.accept(ServerSocketChannelImpl.java:422)
        at sun.nio.ch.ServerSocketChannelImpl.accept(ServerSocketChannelImpl.java:250)
        - locked <0x00000007723d02c0> (a java.lang.Object)
        at org.apache.tomcat.util.net.NioEndpoint.serverSocketAccept(NioEndpoint.java:463)
        at org.apache.tomcat.util.net.NioEndpoint.serverSocketAccept(NioEndpoint.java:73)
        at org.apache.tomcat.util.net.Acceptor.run(Acceptor.java:95)
        at java.lang.Thread.run(Thread.java:745)

"http-nio-8080-ClientPoller" #34 daemon prio=5 os_prio=0 tid=0x00000000244dd800 nid=0x46f4 runnable [0x000000002f2ae000]
   java.lang.Thread.State: RUNNABLE
        at sun.nio.ch.WindowsSelectorImpl$SubSelector.poll0(Native Method)
        at sun.nio.ch.WindowsSelectorImpl$SubSelector.poll(WindowsSelectorImpl.java:296)
        at sun.nio.ch.WindowsSelectorImpl$SubSelector.access$400(WindowsSelectorImpl.java:278)
        at sun.nio.ch.WindowsSelectorImpl.doSelect(WindowsSelectorImpl.java:159)
        at sun.nio.ch.SelectorImpl.lockAndDoSelect(SelectorImpl.java:86)
        - locked <0x0000000772520e70> (a sun.nio.ch.Util$2)
        - locked <0x0000000772520e60> (a java.util.Collections$UnmodifiableSet)
        - locked <0x0000000772520d10> (a sun.nio.ch.WindowsSelectorImpl)
        at sun.nio.ch.SelectorImpl.select(SelectorImpl.java:97)
        at org.apache.tomcat.util.net.NioEndpoint$Poller.run(NioEndpoint.java:708)
        at java.lang.Thread.run(Thread.java:745)
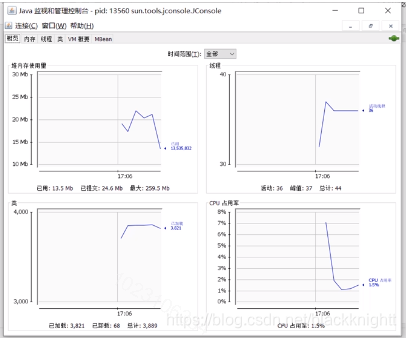
Jconsole
JvisualVM
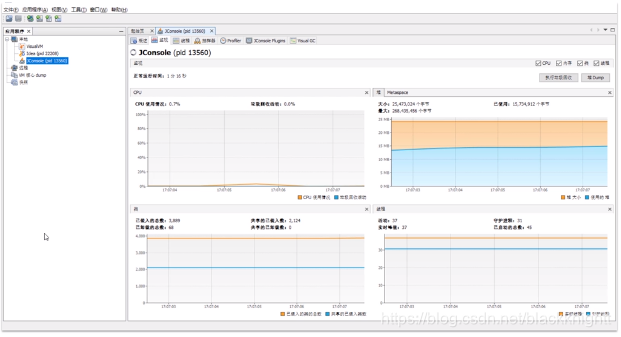
可以看GC信息,也可以看内存信息,也可以看堆栈信息


 被折叠的 条评论
为什么被折叠?
被折叠的 条评论
为什么被折叠?
 到【灌水乐园】发言


