


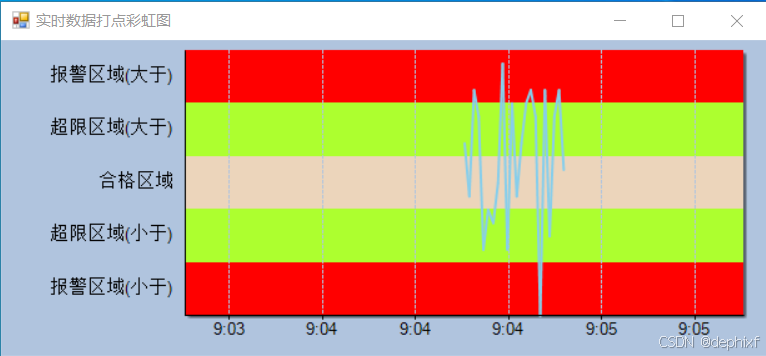
主要用于生产过程中针对关键参数进行实时监控,基于采集到的数据进行打点,并以彩虹图的形式进行展示,代码中使用了Windows Dundas图形控件。
一、整体功能概述
这段代码定义了一个名为RainBow的自定义用户控件类,主要功能是创建一个带有特定图表设置的图表控件,并通过后台线程不断添加随机数据点到图表中,同时设置了不同的区域范围和警戒线等。
二、主要成员变量和方法
-
成员变量:
addDataRunner:用于执行添加数据操作的线程。m_value:存储一个双精度数值。rand:用于生成随机数的Random对象。UpdateHandler和Update:委托和事件,用于触发更新操作。addDataDel:用于添加数据的委托。
-
构造函数
RainBow():- 初始化组件,并将
Update事件与OnUpdate方法关联。
- 初始化组件,并将
-
方法分析:
OnUpdate(object sender, EventArgs e):当Update事件触发时调用的方法,目前注释掉了其中的Start()方法调用。RainBow_Load(object sender, EventArgs e):在用户控件加载时调用,创建并启动添加数据的线程,设置图表的各种属性,包括坐标轴范围、系列类型、警戒线等。Start():初始化图表,设置坐标轴范围、清除现有系列并添加新的系列,设置警戒线和区域标签,最后启动或恢复添加数据的线程。AddDataThreadLoop():在后台线程中不断调用addDataDel委托,实现每隔 1 秒添加数据的操作。AddData():遍历图表的所有系列,调用AddNewPoint方法为每个系列添加新的数据点。AddNewPoint(DateTime timeStamp, Dundas.Charting.WinControl.Series ptSeries):为给定的系列添加新的数据点,新数据点的 Y 值在一定范围内随机生成,确保不小于 0,并根据系列类型进行不同的处理。同时,会移除超过 1.5 分钟的旧数据点,并更新图表的坐标轴范围。Dispose(bool disposing):在释放资源时调用,处理添加数据线程的状态,并释放组件资源。
三、代码优点
- 采用多线程方式添加数据,避免了界面卡顿,提高了用户体验。
- 对图表的设置较为详细,包括坐标轴范围、系列类型、警戒线等,能够满足特定的可视化需求。
- 合理处理了资源释放,确保在控件被销毁时正确地终止线程和释放资源。
四、可能的改进点
- 可以添加更多的错误处理机制,例如在添加数据时可能出现的异常情况。
- 对于随机数的生成,可以考虑使用更具随机性的方法,以避免可能出现的重复或可预测性。
- 可以添加一些注释来解释一些复杂的逻辑部分,提高代码的可读性。
public partial class RainBow : UserControl
{
private Thread addDataRunner;
private double m_value = 0;
public delegate void UpdateHandler(object sender,EventArgs e);
public event UpdateHandler Update;
public double WinccValue
{
get { return m_value; }
set { m_value = value; }
}
private Random rand = new Random();
public delegate void AddDataDelegate();
public AddDataDelegate addDataDel;
public RainBow()
{
InitializeComponent();
this.Update += new UpdateHandler(OnUpdate);
}
private void OnUpdate(object sender, EventArgs e)
{
//Start();
}
private void RainBow_Load(object sender, EventArgs e)
{
ThreadStart addDataThreadStart = new ThreadStart(AddDataThreadLoop);
addDataRunner = new Thread(addDataThreadStart);
addDataDel += new AddDataDelegate(AddData);
Start();
}
private void Start()
{
DateTime minValue = DateTime.Now.AddMinutes(-1);
DateTime maxValue = minValue.AddSeconds(120);
chart.ChartAreas[0].AxisX.Minimum = minValue.ToOADate();
chart.ChartAreas[0].AxisX.Maximum = maxValue.ToOADate();
// Reset number of series in the chart.
chart.Series.Clear();
// create a line chart series
Series newSeries1 = new Series("Default");
newSeries1.Type = SeriesChartType.Line;
newSeries1.BorderWidth = 2;
//newSeries1.XAxisType = ChartValueTypes.Time;
newSeries1.XValueType = ChartValueTypes.Time;
chart.Series.Add(newSeries1);
chart.ChartAreas[0].AxisY.Minimum = 10;// ToOADate();
chart.ChartAreas[0].AxisY.Maximum = 30;
//chart.Series[0].ShowLabelAsValue = true;
//chart.ChartAreas[0].AxisX.View.Zoomable = true;
//chart.ChartAreas[0].CursorX.AutoScroll = true;
int element = chart.ChartAreas["Default"].AxisY.CustomLabels.Add(10, 14, "报警区域(小于)");
element = chart.ChartAreas["Default"].AxisY.CustomLabels.Add(14, 18, "超限区域(小于)");
element = chart.ChartAreas["Default"].AxisY.CustomLabels.Add(18, 22, "合格区域");
element = chart.ChartAreas["Default"].AxisY.CustomLabels.Add(22, 26, "超限区域(大于)");
element = chart.ChartAreas["Default"].AxisY.CustomLabels.Add(26, 30, "报警区域(大于)");
StripLine stripLWarn = new StripLine();
stripLWarn.IntervalOffset = 10;
stripLWarn.StripWidth = 4;
stripLWarn.BackColor = Color.Red;
StripLine stripLow = new StripLine();
stripLow.IntervalOffset = 14;
stripLow.StripWidth = 4;
stripLow.BackColor = Color.GreenYellow;
StripLine stripMed = new StripLine();
stripMed.IntervalOffset = 18;
stripMed.StripWidth = 4;
stripMed.BackColor = Color.FromArgb(64, Color.Orange);
StripLine stripHigh = new StripLine();
stripHigh.IntervalOffset = 22;
stripHigh.StripWidth = 4;
stripHigh.BackColor = Color.GreenYellow;
StripLine stripUwarn = new StripLine();
stripUwarn.IntervalOffset = 26;
stripUwarn.StripWidth = 4;
stripUwarn.BackColor = Color.Red;
chart.ChartAreas["Default"].AxisY.StripLines.Add(stripLow);
chart.ChartAreas["Default"].AxisY.StripLines.Add(stripMed);
chart.ChartAreas["Default"].AxisY.StripLines.Add(stripHigh);
chart.ChartAreas["Default"].AxisY.StripLines.Add(stripLWarn);
chart.ChartAreas["Default"].AxisY.StripLines.Add(stripUwarn);
//Series newSeries1 = new Series("SeriesDownError");
//newSeries1.Type = SeriesChartType.Area;
//newSeries1.BorderWidth = 2;
//chart.Series.Add(newSeries1);
//Series newSeries2 = new Series("SeriesUpError");
//newSeries2.Type = SeriesChartType.Area;
//newSeries2.BorderWidth = 2;
//newSeries2.
//chart.Series.Add(newSeries2);
Series newSeries = new Series("Series");
newSeries.Type = SeriesChartType.Spline;
newSeries.BorderWidth = 2;
newSeries.ShowLabelAsValue = false;
newSeries.Color = Color.OrangeRed;
newSeries.XValueType = ChartValueTypes.Time;
chart.Series.Add(newSeries);
// start worker threads.
if (addDataRunner.IsAlive == true)
{
addDataRunner.Resume();
}
else
{
addDataRunner.Start();
}
}
private void AddDataThreadLoop()
{
while (true)
{
chart.Invoke(addDataDel);
Thread.Sleep(1000);
}
}
public void AddData()
{
DateTime timeStamp = DateTime.Now;
foreach (Series ptSeries in chart.Series)
{
AddNewPoint(timeStamp, ptSeries);
}
}
/// The AddNewPoint function is called for each series in the chart when
/// new points need to be added. The new point will be placed at specified
/// X axis (Date/Time) position with a Y value in a range +/- 1 from the previous
/// data point's Y value, and not smaller than zero.
public void AddNewPoint(DateTime timeStamp, Dundas.Charting.WinControl.Series ptSeries)
{
double newVal = 0;
if (ptSeries.Points.Count > 0)
{
newVal = ptSeries.Points[ptSeries.Points.Count - 1].YValues[0] + ((rand.NextDouble() * 2) - 1);
}
if (newVal < 0)
newVal = 0;
// Add new data point to its series.
//ptSeries.Points.AddXY(timeStamp.ToOADate(), WinccValue);
//chart.Series["Series1"].Points.AddY(15);
//if (ptSeries.Type == SeriesChartType.Area)
//{
// ptSeries.Points.AddXY(timeStamp.ToOADate(),15);
//}
//else
//{
if (ptSeries.Type == SeriesChartType.Line)
{
//ptSeries.Points.AddXY(timeStamp.ToOADate(), WinccValue);
ptSeries.Points.AddXY(timeStamp.ToOADate(), rand.Next(10,30));
}
//}
// remove all points from the source series older than 1.5 minutes.
//double removeBefore = timeStamp.AddSeconds((double)(90) * (-1)).ToOADate();
remove oldest values to maintain a constant number of data points
//while (ptSeries.Points[0].XValue < removeBefore)
//{
// ptSeries.Points.RemoveAt(0);
//}
//chart.ChartAreas[0].AxisX.Minimum = ptSeries.Points[0].XValue;
//chart.ChartAreas[0].AxisX.Maximum = DateTime.FromOADate(ptSeries.Points[0].XValue).AddMinutes(2).ToOADate();
chart.Invalidate();
}
/// Clean up any resources being used.
protected override void Dispose(bool disposing)
{
if ((addDataRunner.ThreadState & ThreadState.Suspended) == ThreadState.Suspended)
{
addDataRunner.Resume();
}
addDataRunner.Abort();
if (disposing)
{
if (components != null)
{
components.Dispose();
}
}
base.Dispose(disposing);
}
}
源代码下载:https://download.youkuaiyun.com/download/bjhtgy/89747059


 被折叠的 条评论
为什么被折叠?
被折叠的 条评论
为什么被折叠?
 到【灌水乐园】发言


