四十六、openlayers官网示例Icon Sprites with WebGL解析——使用WebGLPoints加载海量点数据。普通矢量图层加载点数据和webgl加载点数据性能对比

官网demo地址:

Icon Sprites with WebGL

这篇讲的是使用webgl加载海量的数据点。

首先忘地图上添加了底图。

const rasterLayer = new Tile({
      source: new OGCMapTile({
        url: "https://maps.gnosis.earth/ogcapi/collections/NaturalEarth:raster:HYP_HR_SR_OB_DR/map/tiles/WebMercatorQuad",
        crossOrigin: "",
      }),
    });
    const map = new Map({
      layers: [rasterLayer],
      target: document.getElementById("map"),
      view: new View({
        center: [0, 4000000],
        zoom: 2,
      }),
    });

然后请求一个文件,获取点数据。 

 const client = new XMLHttpRequest();
    client.open(
      "GET",
      "https://openlayers.org/en/latest/examples/data/csv/ufo_sighting_data.csv"
    );
    client.addEventListener("load", function () {
      const csv = client.responseText;
      
    });
    client.send();

 请求回来的数据是这样的。

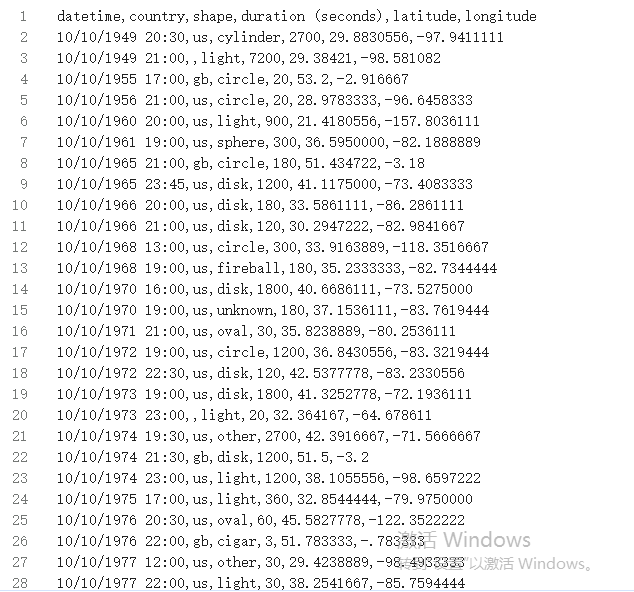
 所以要对数据进行一些切割处理,最终生成feature

const shapeTypes = {};
      const features = [];

      let prevIndex = csv.indexOf("\n") + 1;
      let curIndex;
      while ((curIndex = csv.indexOf("\n", prevIndex)) !== -1) {
        const line = csv.substring(prevIndex, curIndex).split(",");
        prevIndex = curIndex + 1;

        const coords = [parseFloat(line[5]), parseFloat(line[4])];
        const shape = line[2];
        shapeTypes[shape] = (shapeTypes[shape] || 0) + 1;

        features.push(
          new Feature({
            datetime: line[0],
            year: parseInt(/[0-9]{4}/.exec(line[0])[0], 10),
            shape: shape,
            duration: line[3],
            geometry: new Point(fromLonLat(coords)),
          })
        );
      }
      shapeTypes["all"] = features.length;

然后使用WebGLPointsLayer类构建一个图层并添加到地图上

 map.addLayer(
        new WebGLPointsLayer({
          source: new VectorSource({
            features: features,
            attributions: "National UFO Reporting Center",
          }),
          style: style,
        })
      );

 将不同类型的数据筛选条件添加进下拉框。

    fillShapeSelect(shapeTypes);
    function fillShapeSelect(shapeTypes) {
      Object.keys(shapeTypes)
        .sort(function (a, b) {
          return shapeTypes[b] - shapeTypes[a];
        })
        .forEach(function (shape) {
          const option = document.createElement("option");
          const sightings = shapeTypes[shape];
          option.text = `${shape} (${sightings} sighting${
            sightings === 1 ? "" : "s"
          })`;
          option.value = shape;
          shapeSelect.appendChild(option);
        });
    }

 下拉框的筛选效果是通过在style中定义变量filterShape、feature中添加自定义属性shape、以及下拉框中的value值结合实现的。下拉框的改变会更改style.variables.filterShape的值,然后调用地图的render方法来更新地图。

 const style = {
      variables: {
        filterShape: "all",
      },
      filter: [
        "any",
        ["==", ["var", "filterShape"], "all"],
        ["==", ["var", "filterShape"], ["get", "shape"]],
      ],
      "icon-src":
        "https://openlayers.org/en/latest/examples/data/ufo_shapes.png",
      "icon-width": 128,
      "icon-height": 64,
      "icon-color": [
        "interpolate",
        ["linear"],
        ["get", "year"],
        1950,
        oldColor,
        2013,
        newColor,
      ],
      "icon-offset": [
        "match",
        ["get", "shape"],
        "light",
        [0, 0],
        "sphere",
        [32, 0],
        "circle",
        [32, 0],
        "disc",
        [64, 0],
        "oval",
        [64, 0],
        "triangle",
        [96, 0],
        "fireball",
        [0, 32],
        [96, 32],
      ],
      "icon-size": [32, 32],
      "icon-scale": 0.5,
    };

图层渲染出来之后,可以看到,放大缩小、筛选操作地图的表现是非常流畅的,基本没有卡顿。

接下来,咱们来看看使用普通矢量图层加载海量数据点的表现。原本的style中的变量定义是WebGLPointsLayer的一些固定写法,和普通的矢量图层接受的style不一样。所以我们这里精简一下样式。

const style_common = {
      "icon-src":
        "https://openlayers.org/en/latest/examples/data/ufo_shapes.png",
      "icon-width": 128,
      "icon-height": 64,
      "icon-color": newColor,
      "icon-size": [32, 32],
      "icon-scale": 0.5,
    };

 map.addLayer(
        new VectorLayer({
        source: new VectorSource({
             features: features,
             attributions: "National UFO Reporting Center",
        }),
        style: style_common,
       })
 );

 加载上去之后,地图操作会有一些卡顿,我这里录屏可能看的不是很明显,但基本每个操作都有延迟。

总的来说,使用WebGLPointsLayer加载海量点数据性能会好很多。 但是webgl相关的api都还处于调试状态,官网api的api文档都没更新,大家如果日常项目中要使用的话可能还需要斟酌一下。

完整代码:

<template>
  <div class="box">
    <h1>Icon Sprites with WebGL</h1>
    <div id="map" class="map"></div>
    <div>Current sighting: <span id="info"></span></div>
    <div>
      <label for="shape-filter">Filter by UFO shape:</label>
      <select id="shape-filter"></select>
    </div>
  </div>
</template>

<script>
import Feature from "ol/Feature.js";
import Map from "ol/Map.js";
import Point from "ol/geom/Point.js";
import TileLayer from "ol/layer/WebGLTile.js";
import View from "ol/View.js";
import WebGLPointsLayer from "ol/layer/WebGLPoints.js";
import XYZ from "ol/source/XYZ.js";
import { fromLonLat } from "ol/proj.js";
import { OGCMapTile, Vector as VectorSource } from "ol/source.js";
import { Tile, Vector as VectorLayer } from "ol/layer.js";
export default {
  name: "",
  components: {},
  data() {
    return {
      map: null,
      extentData: "",
      message: {
        name: "",
        color: "",
      },
    };
  },
  computed: {},
  created() {},
  mounted() {
    const rasterLayer = new Tile({
      source: new OGCMapTile({
        url: "https://maps.gnosis.earth/ogcapi/collections/NaturalEarth:raster:HYP_HR_SR_OB_DR/map/tiles/WebMercatorQuad",
        crossOrigin: "",
      }),
    });
    const map = new Map({
      layers: [rasterLayer],
      target: document.getElementById("map"),
      view: new View({
        center: [0, 4000000],
        zoom: 2,
      }),
    });

    const oldColor = [255, 160, 110];
    const newColor = [180, 255, 200];

    const style = {
      variables: {
        filterShape: "all",
      },
      filter: [
        "any",
        ["==", ["var", "filterShape"], "all"],
        ["==", ["var", "filterShape"], ["get", "shape"]],
      ],
      "icon-src":
        "https://openlayers.org/en/latest/examples/data/ufo_shapes.png",
      "icon-width": 128,
      "icon-height": 64,
      "icon-color": [
        "interpolate",
        ["linear"],
        ["get", "year"],
        1950,
        oldColor,
        2013,
        newColor,
      ],
      "icon-offset": [
        "match",
        ["get", "shape"],
        "light",
        [0, 0],
        "sphere",
        [32, 0],
        "circle",
        [32, 0],
        "disc",
        [64, 0],
        "oval",
        [64, 0],
        "triangle",
        [96, 0],
        "fireball",
        [0, 32],
        [96, 32],
      ],
      "icon-size": [32, 32],
      "icon-scale": 0.5,
    };

    const style_common = {
      "icon-src":
        "https://openlayers.org/en/latest/examples/data/ufo_shapes.png",
      "icon-width": 128,
      "icon-height": 64,
      "icon-color": newColor,
      "icon-size": [32, 32],
      "icon-scale": 0.5,
    };

    const shapeSelect = document.getElementById("shape-filter");
    shapeSelect.addEventListener("input", function () {
      style.variables.filterShape = shapeSelect.value;
      map.render();
    });
    function fillShapeSelect(shapeTypes) {
      Object.keys(shapeTypes)
        .sort(function (a, b) {
          return shapeTypes[b] - shapeTypes[a];
        })
        .forEach(function (shape) {
          const option = document.createElement("option");
          const sightings = shapeTypes[shape];
          option.text = `${shape} (${sightings} sighting${
            sightings === 1 ? "" : "s"
          })`;
          option.value = shape;
          shapeSelect.appendChild(option);
        });
    }

    const client = new XMLHttpRequest();
    client.open(
      "GET",
      "https://openlayers.org/en/latest/examples/data/csv/ufo_sighting_data.csv"
    );
    client.addEventListener("load", function () {
      const csv = client.responseText;
      const shapeTypes = {};
      const features = [];

      let prevIndex = csv.indexOf("\n") + 1;
      let curIndex;
      while ((curIndex = csv.indexOf("\n", prevIndex)) !== -1) {
        const line = csv.substring(prevIndex, curIndex).split(",");
        prevIndex = curIndex + 1;

        const coords = [parseFloat(line[5]), parseFloat(line[4])];
        const shape = line[2];
        shapeTypes[shape] = (shapeTypes[shape] || 0) + 1;

        features.push(
          new Feature({
            datetime: line[0],
            year: parseInt(/[0-9]{4}/.exec(line[0])[0], 10),
            shape: shape,
            duration: line[3],
            geometry: new Point(fromLonLat(coords)),
          })
        );
      }
      shapeTypes["all"] = features.length;
        map.addLayer(
            new WebGLPointsLayer({
            source: new VectorSource({
                features: features,
                attributions: "National UFO Reporting Center",
            }),
            style: style,
            })
        );
      fillShapeSelect(shapeTypes);
    });
    client.send();

    const info = document.getElementById("info");
    map.on("pointermove", function (evt) {
      if (map.getView().getInteracting() || map.getView().getAnimating()) {
        return;
      }
      const text = map.forEachFeatureAtPixel(evt.pixel, function (feature) {
        const datetime = feature.get("datetime");
        const duration = feature.get("duration");
        const shape = feature.get("shape");
        return `On ${datetime}, lasted ${duration} seconds and had a "${shape}" shape.`;
      });
      info.innerText = text || "";
    });
  },
  methods: {
  },
};
</script>

<style lang="scss" scoped>
#map {
  width: 100%;
  height: 500px;
}
.box {
  height: 100%;
}
</style>

评论
添加红包

请填写红包祝福语或标题

红包个数最小为10个

红包金额最低5元

当前余额3.43前往充值 >
需支付:10.00
成就一亿技术人!
领取后你会自动成为博主和红包主的粉丝 规则
hope_wisdom
发出的红包
实付
使用余额支付
点击重新获取
扫码支付
钱包余额 0

抵扣说明:

1.余额是钱包充值的虚拟货币,按照1:1的比例进行支付金额的抵扣。
2.余额无法直接购买下载,可以购买VIP、付费专栏及课程。

余额充值