


ggplot2拥有强大的绘图功能,当我们需要将多个ggplot2绘制的图片组合在一种图片中时,可选方法之一就是使用ggpubr包中的ggarrange函数,该函数的一大优点就是可以自动设置多张图片共用一个图例(使用第一张图片的图例),并且自动调整图片之间的比例。
话不多说,上代码:
library(ggplot2)
# 构建数据集
data_ab <- ToothGrowth
data_ab$dose <- as.factor(data_ab$dose)
data_ab$len2 <- data_ab$len / 10
# 绘制图形
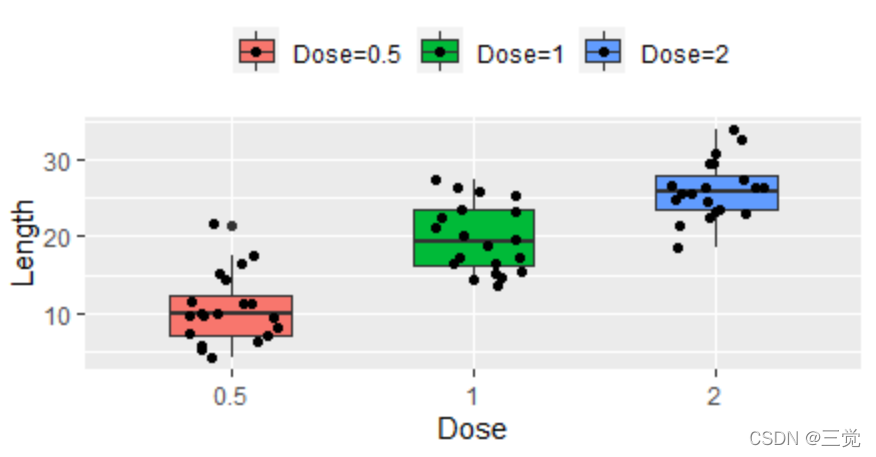
a <- ggplot(data = data_ab, aes(x = dose, y = len, fill = dose)) +
geom_boxplot(width = 0.5) +
# 给箱式图添加散点
geom_jitter(shape = 16, position = position_jitter(0.2), color = "black") +
# 坐标轴标签
labs(x = "Dose", y = "Length") +
# 修改legend
scale_fill_discrete(name = "", breaks = c(0.5, 1, 2),
labels = paste("Dose=", c(0.5, 1, 2), sep = "")) +
# 修改legend位置
theme(legend.position = "top")
print(a)
图片a如下:
接着绘制图片b:
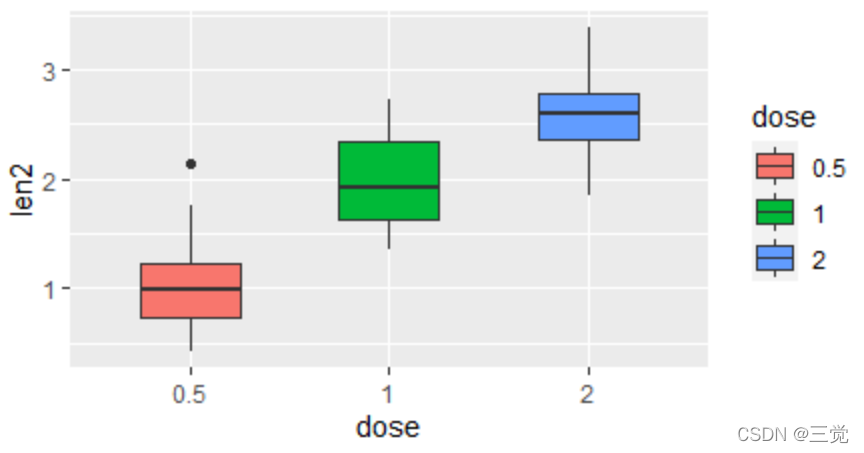
b <- ggplot(data = data_ab, aes(x = dose, y = len2, fill = dose)) +
  geom_boxplot(width = 0.5)
print(b)
图片b如下所示:
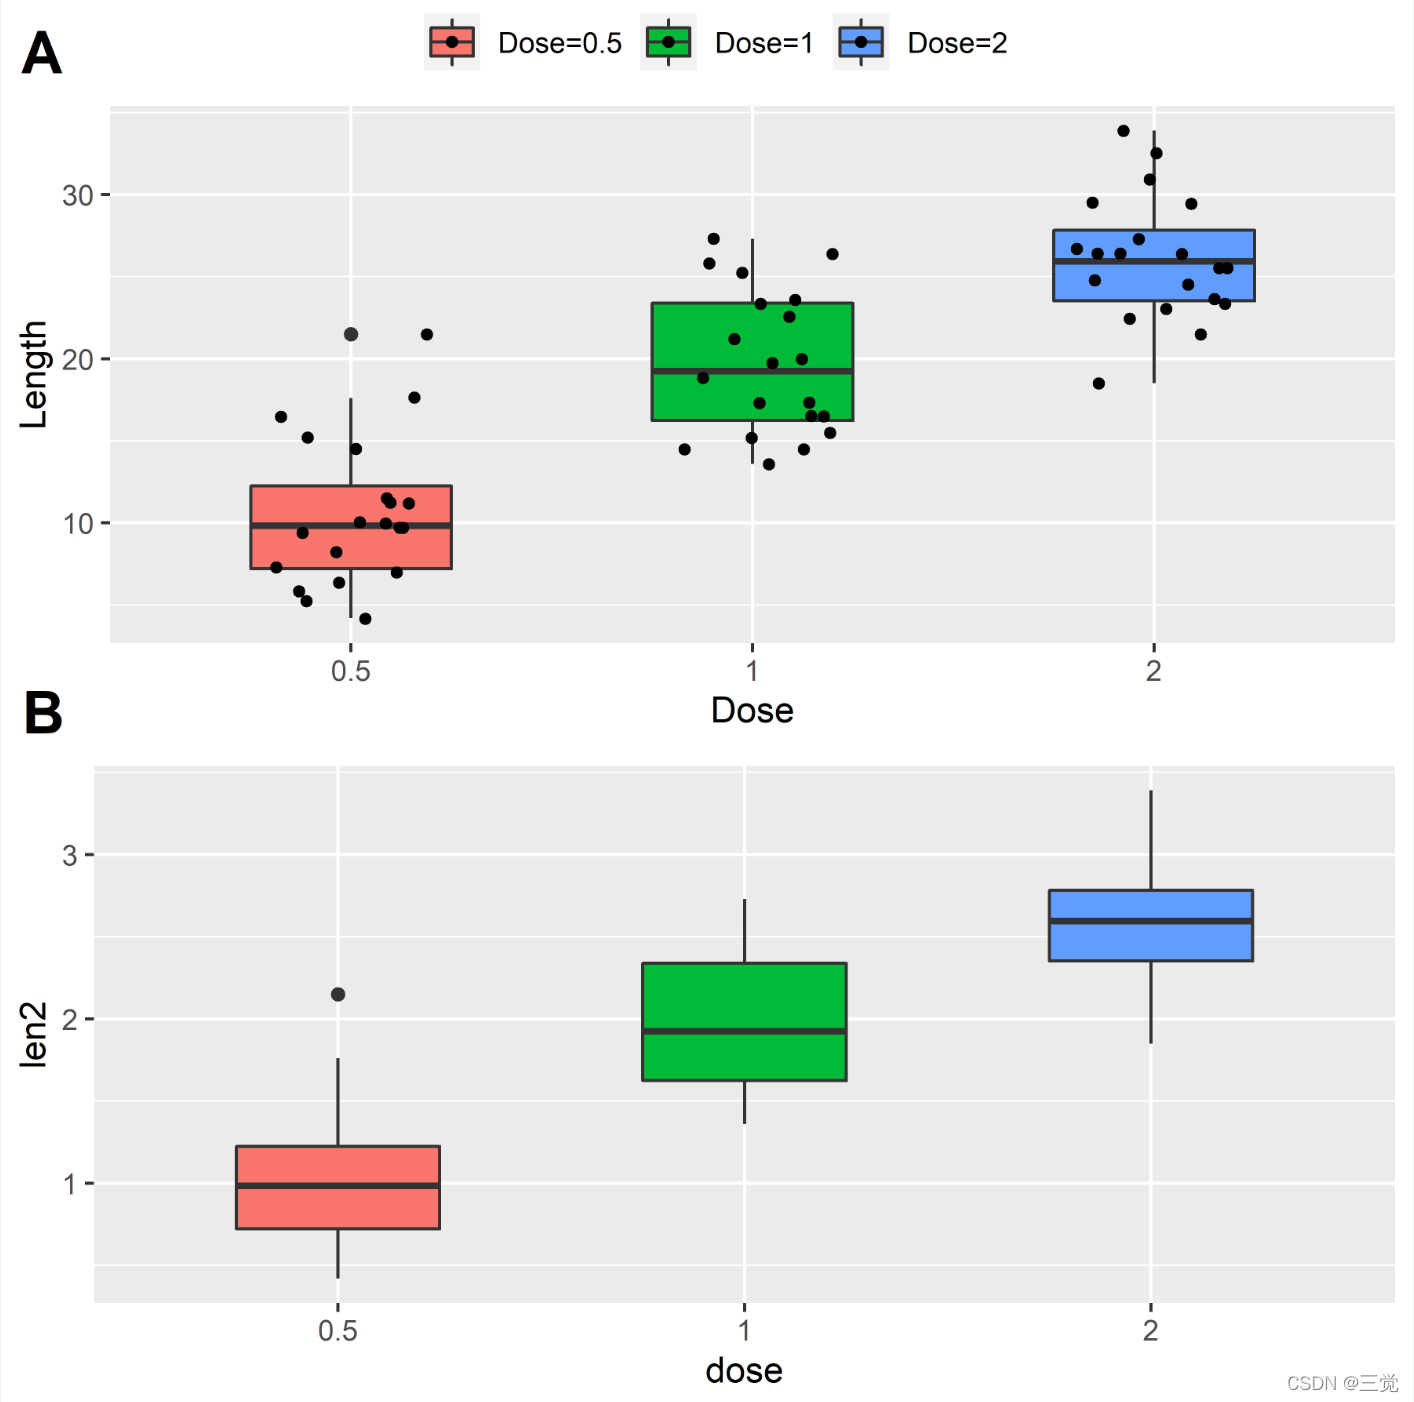
使用ggpubr将上述两张图片组合在一起,并为每张图片添加一个标签:
# 使用ggarange将a和b组合在一起, ggarange的一大优点是其合并legend
library(ggpubr)
tiff("ggpubr1.tiff", res = 600, width = 3600, height = 3600, compression = "lzw")
ggarrange(
  a, b, # 指定待组合的图
  ncol = 1, nrow = 2, # 组合图的行列数
  labels = c("A", "B"), # 组合图标注标签
  label.x = -0.0, label.y = 1.12, # 标签所在位置
  font.label = list(size = 18, face = "bold"), # 标签字体
  common.legend = T # 共用图例, 选用第一张图的图例
)
dev.off()
在本地生成的图片如下图所示:
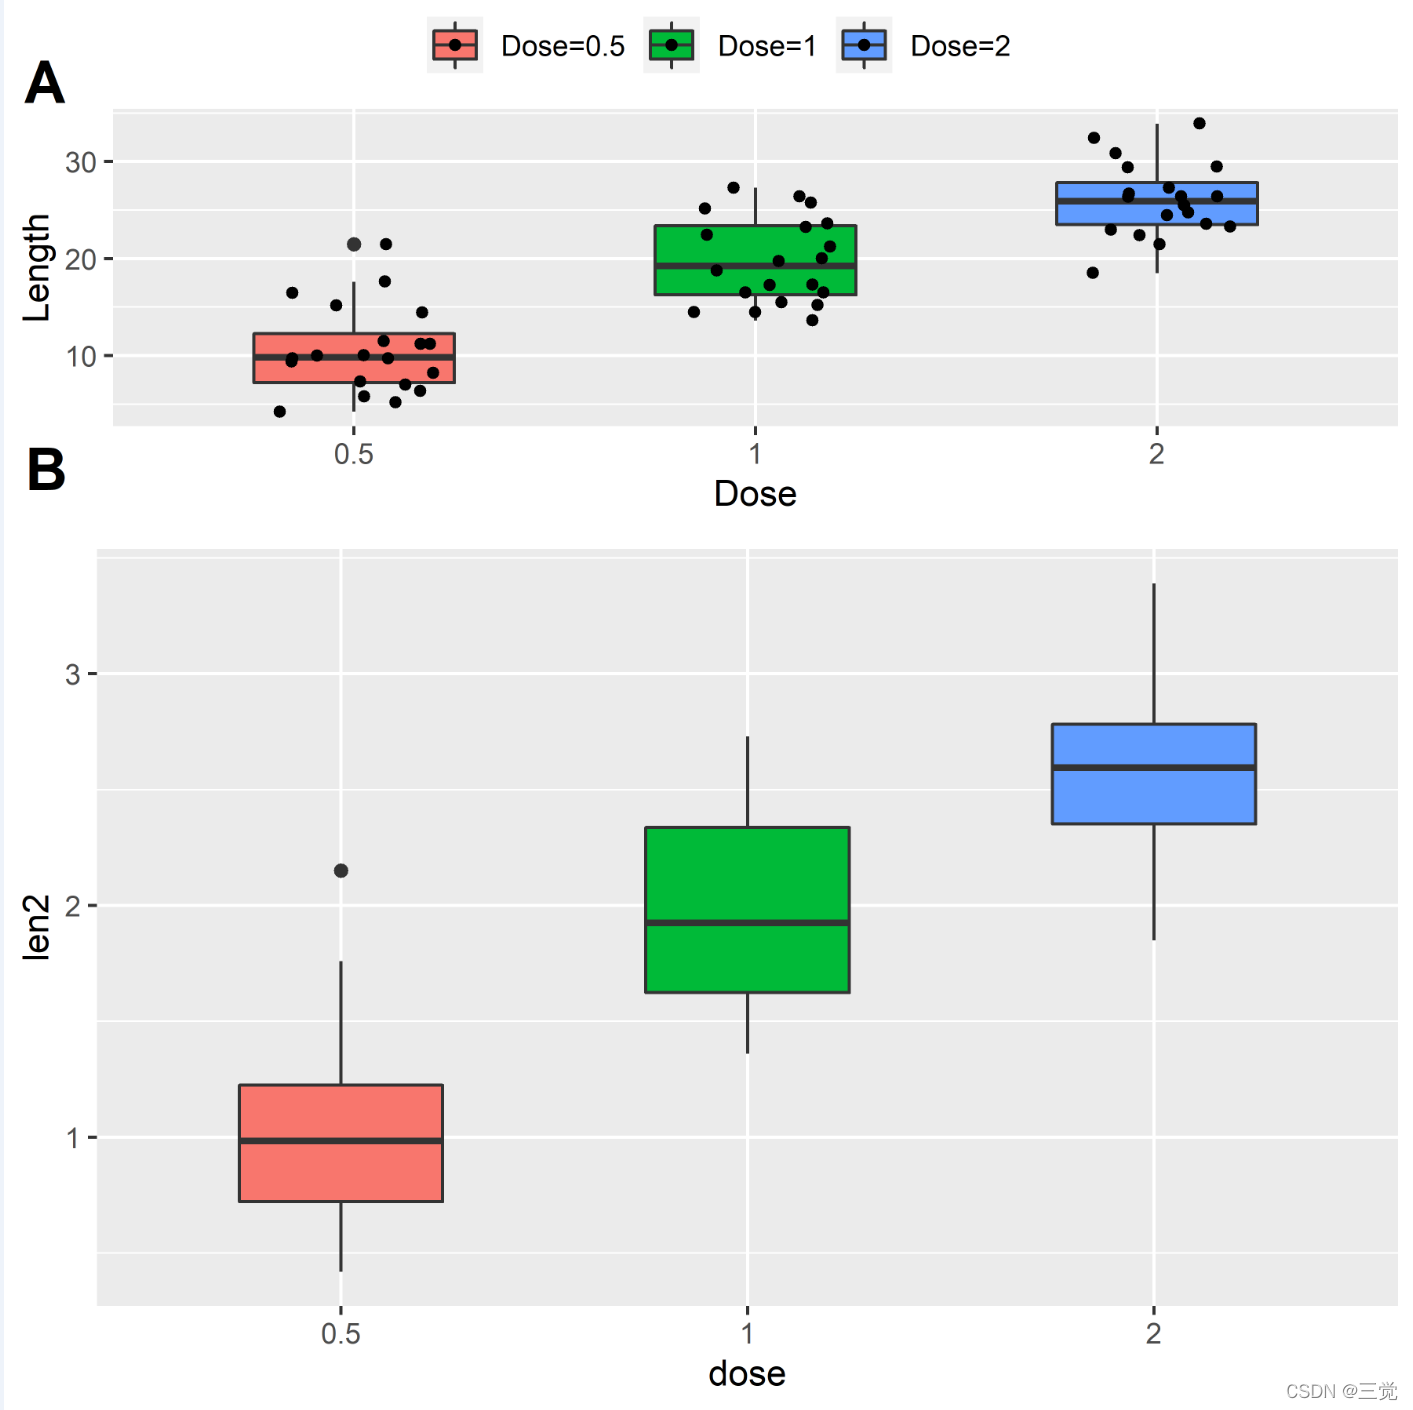
在ggarrange中,还可以修改两张图片的占比:
tiff("ggpubr2.tiff", res = 600, width = 3600, height = 3600, compression = "lzw")
ggarrange(
  a, b,
  ncol = 1, nrow = 2,
  common.legend = T,
  labels = c("A", "B"),
  label.x = -0.0, label.y = 1.12,
  font.label = list(size = 18, face = "bold"),
  heights = c(0.5, 1) # 指定两张图片的高度占比
)
dev.off()
结果如下图:
接着,再绘制一张图c,将其与上述组合图进行组合:
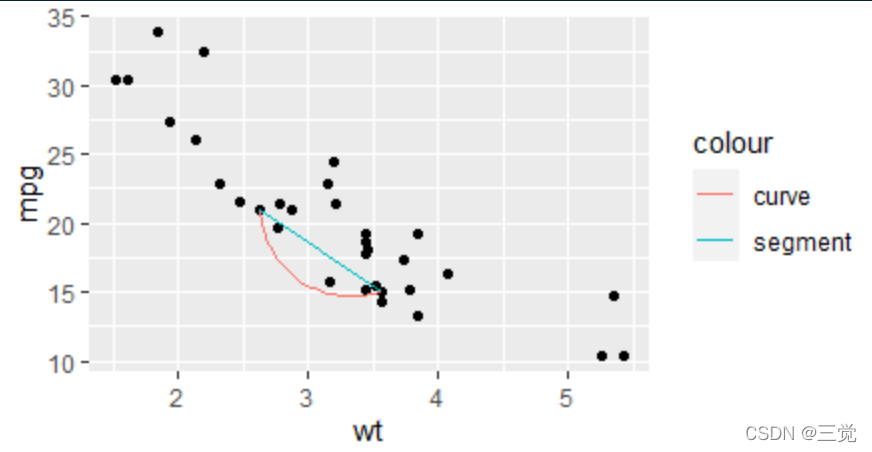
c <- ggplot(mtcars, aes(wt, mpg)) +
  geom_point() +
  geom_curve(aes(x = 2.62, y = 21.0, xend = 3.57, yend = 15.0, colour = "curve")) +
  geom_segment(aes(x = 2.62, y = 21.0, xend = 3.57, yend = 15.0, colour = "segment"))
print(c)
图c如下所示:
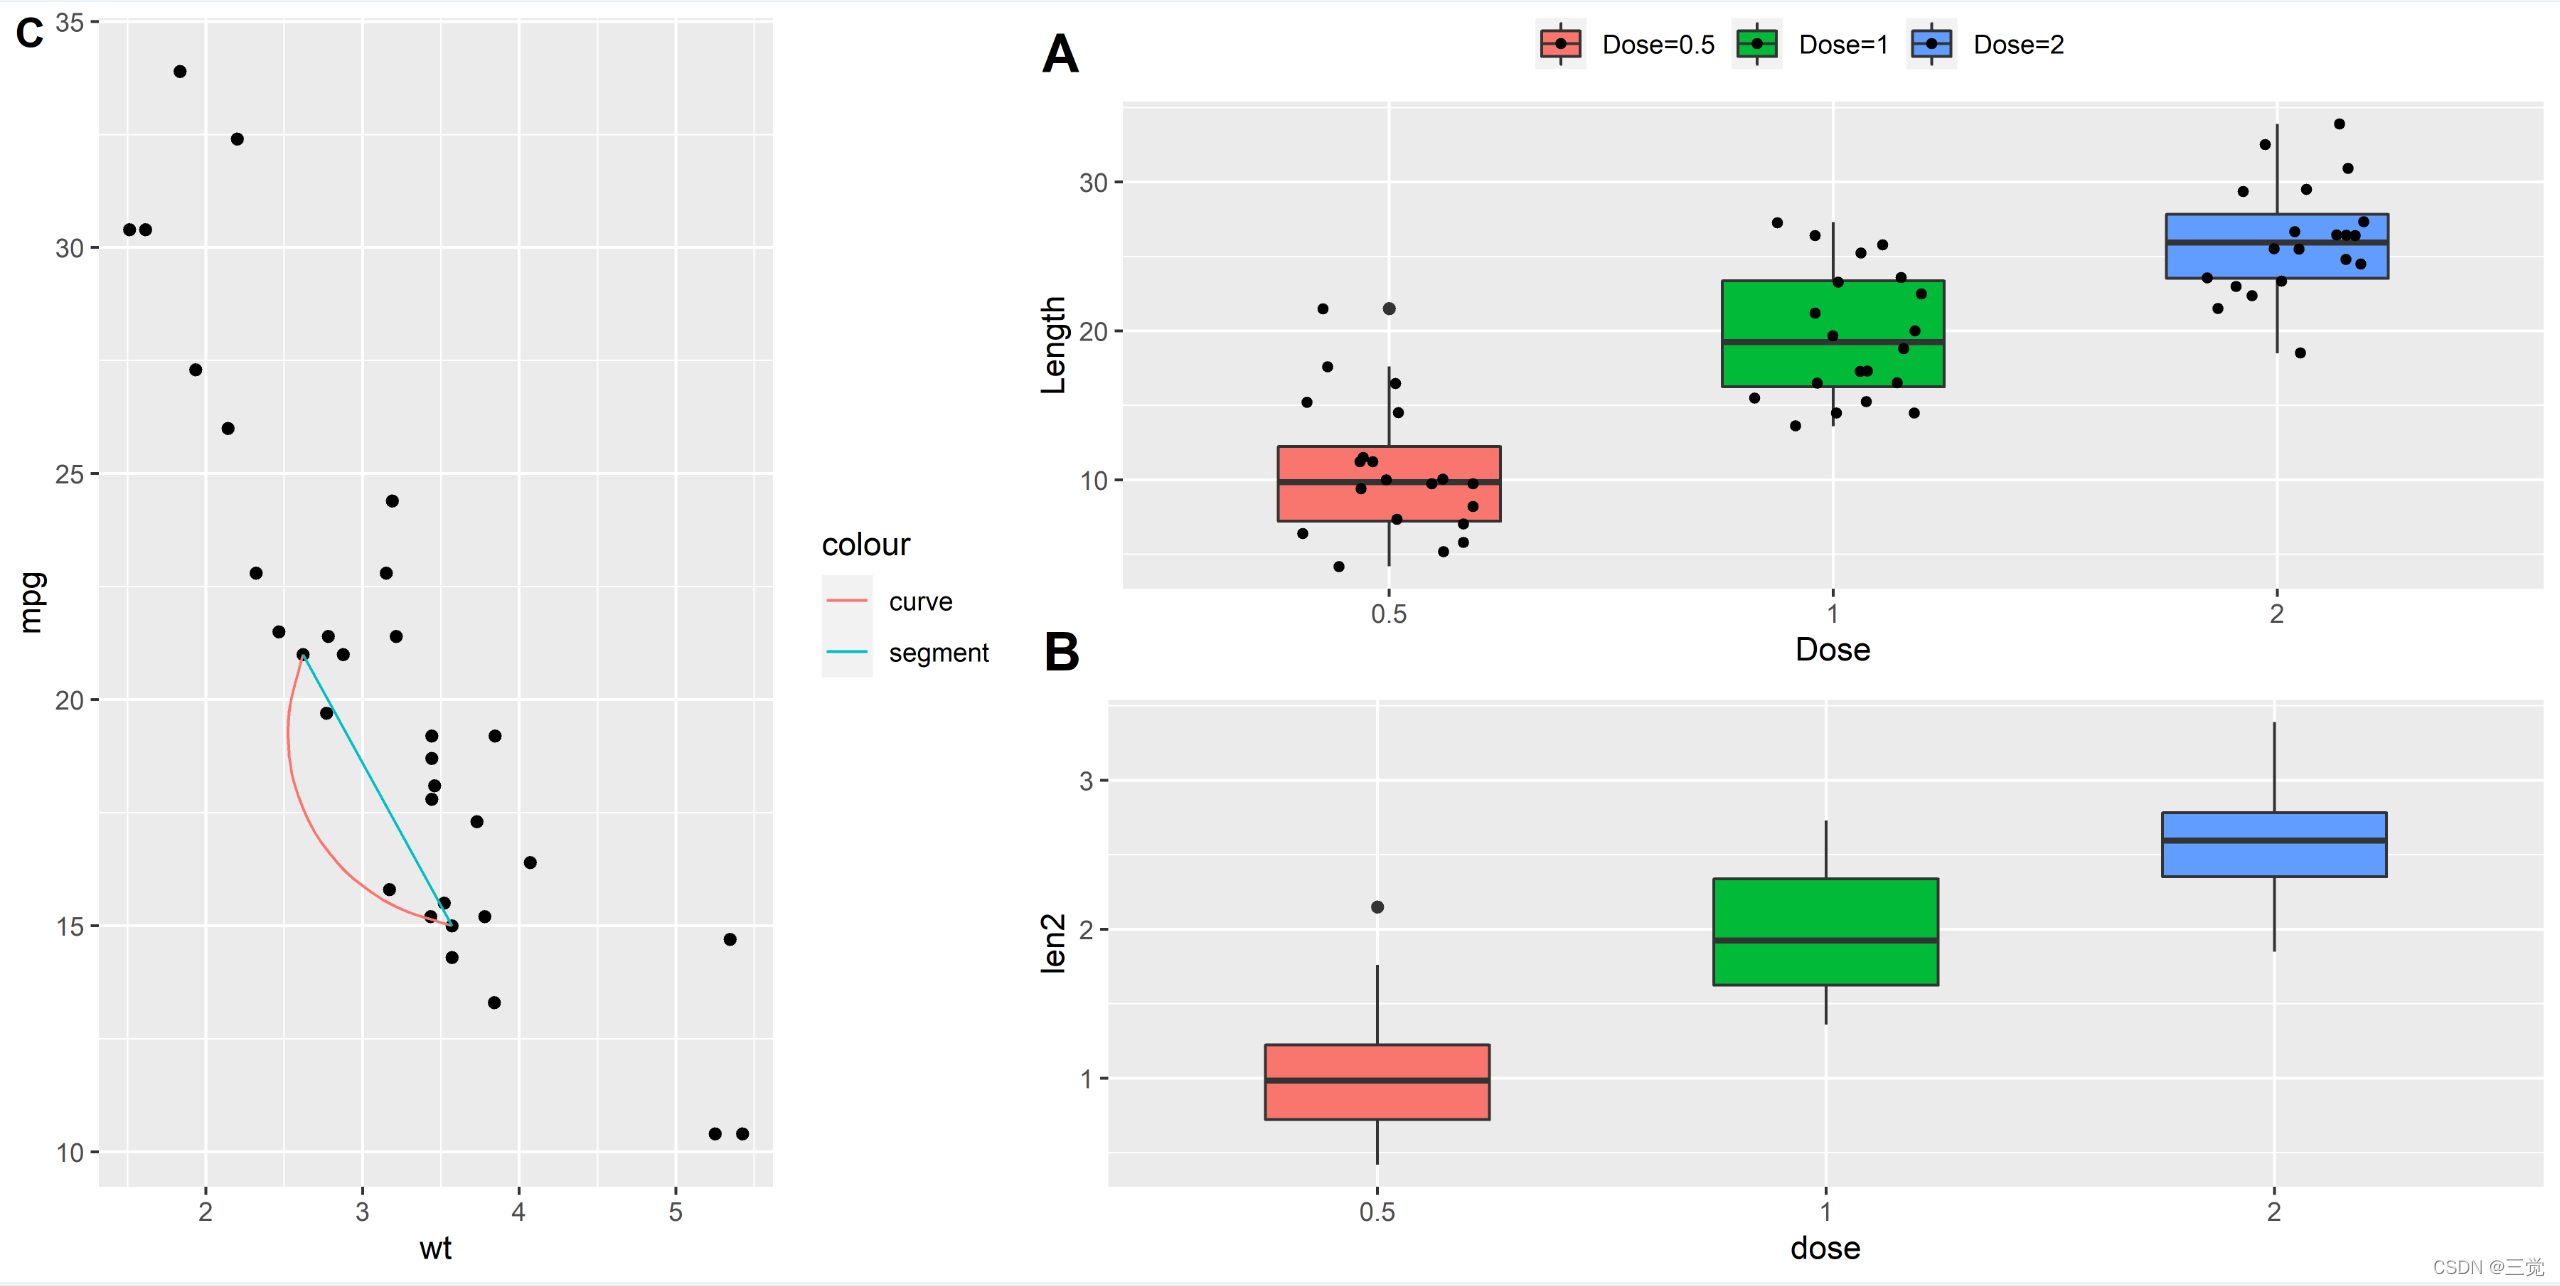
将c与ab的组合图组合在一起, 使c占图片左侧1/2; a与b联合占右侧1/2
tiff("ggpubr3.tiff", res = 600, width = 7200, height = 3600, compression = "lzw")
plot_ab <- ggarrange(
  a, b,
  ncol = 1, nrow = 2,
  common.legend = T,
  labels = c("A", "B"),
  label.x = -0.0, label.y = 1.12,
  font.label = list(size = 18, face = "bold")
)
plot_abc <- ggarrange(c, plot_ab, ncol = 2, nrow = 1, labels = c("C", ""),
                      label.x = 0.0, label.y = 1.0, widths = c(0.8, 1.2))
print(plot_abc)
dev.off()
生成图片结果如下:


 369
369

 被折叠的 条评论
为什么被折叠?
被折叠的 条评论
为什么被折叠?
 到【灌水乐园】发言


