


 文章介绍了如何从GitHub获取和处理PEMS04交通数据集,包括数据可视化、数据预处理(如窗口划分和缺失值处理),以及使用ASTGCN模型进行时间序列预测。同时提及了环境配置中的依赖项安装问题及其解决方案。

源码地址:https://github.com/guoshnBJTU/ASTGCN-2019-pytorch
数据集下载地址: https://github.com/guoshnBJTU/ASTGNN/tree/main/data
关于数据生成部分更详细的解析可以看这篇文章: https://blog.youkuaiyun.com/Yukee_/article/details/140325814
数据集相关
-
在项目目录中新建data文件夹,并把下载的数据集放进去
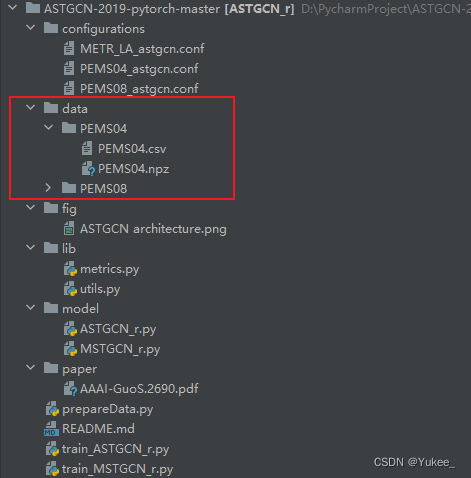
-
数据集可视化介绍
双击PEMS04.csv
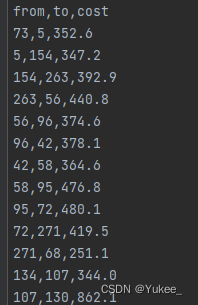
from,to表示从某个传感器到另一个传感器,cost表示两个传感器之间的距离。在
data同级目录新建lodaData.py文件
import numpy as np
import matplotlib as plt

pems04_data=np.load('./data/PEMS04/PEMS04.npz ')
print(pems04_data.files)#查看npz文件里面有哪些字段
#['data']
print(pems04_data['data'].shape)#查看data字段的维度
#(16992, 307, 3)
#16992=59天×24小时×12(五分钟记录一次),307为探测器数量,3为特征数量
#特征:流量、平均速度、平均占用率

flow=pems04_data['data'][:,0,0]
speed=pems04_data['data'][:,0,1]
occupy=pems04_data['data'][:,0,2]
fig=plt.figure(figsize=(15,5))
plt.title('traffic flow in San Francisco')
plt.xlabel('day')
plt.ylabel('flow')

plt.plot(np.arange(len(flow)),flow,linestyle='-')
#plt.plot(np.arange(len(flow)),speed,linestyle='-')
#plt.plot(np.arange(len(flow)),occupy,linestyle='-')

fig.autofmt_xdate(rotation=45)#x轴的刻度标签逆时针旋转45度
plt.show()
报错: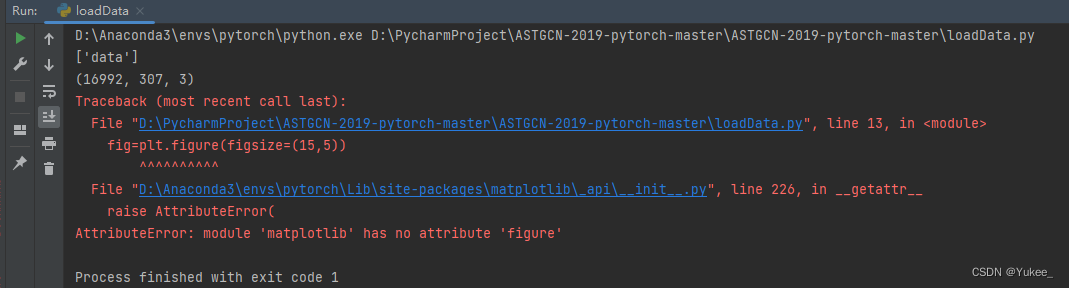
解决:
将
import matplotlib as plt
改为
import matplotlib.pyplot as plt
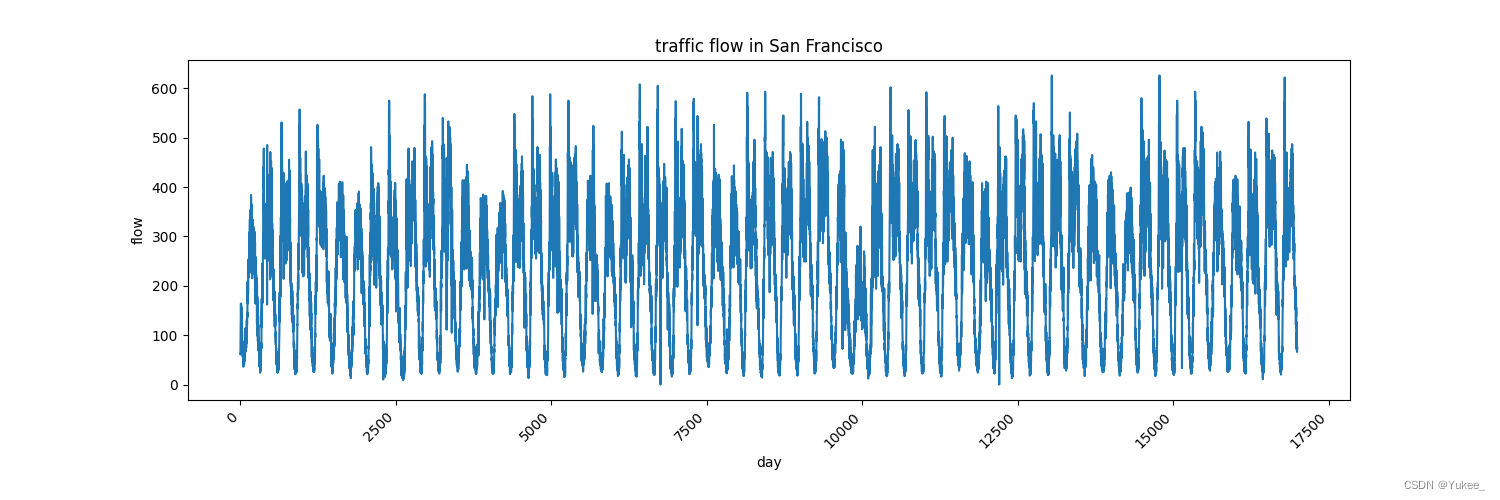
流量特征如图所示:16992个数据(59天每五分钟记录的一次)
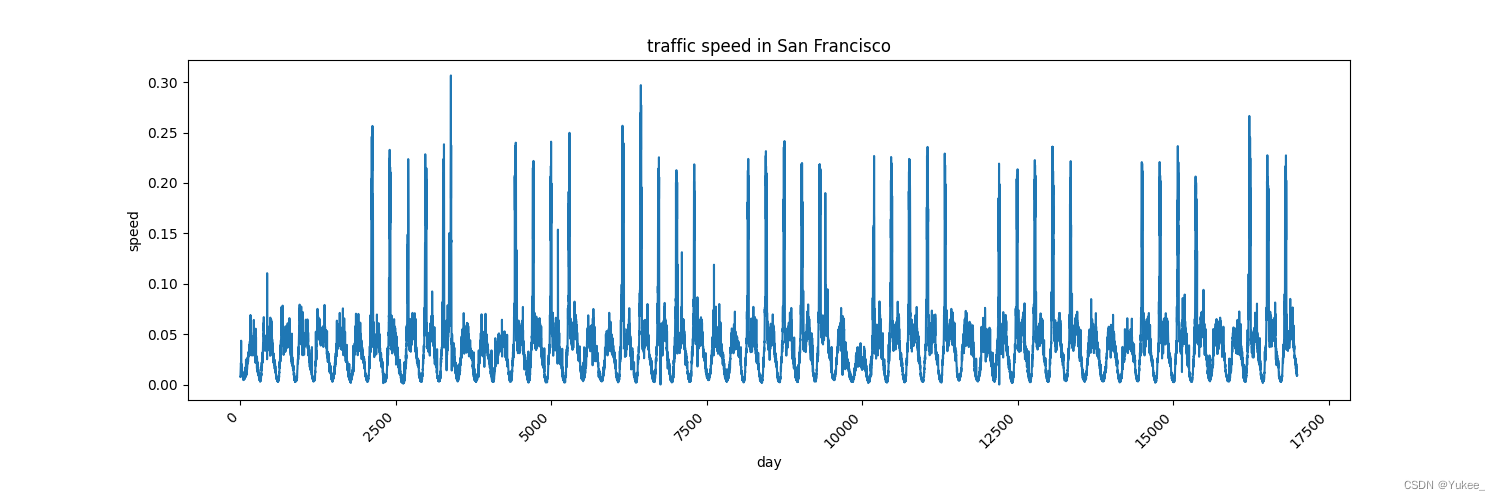
速度特征如图所示:16992个数据(59天每五分钟记录的一次)
- 数据集处理
prepareData.py
def read_and_generate_dataset(graph_signal_matrix_filename,
                                                     num_of_weeks, num_of_days,#采用一周一天还是一个小时的时间
                                                     num_of_hours, num_for_predict,#预测未来多长时间
                                                     points_per_hour=12, save=False):#规定一个小时记录12次
在configurations文件夹下的PEMS04_astgcn.conf定义上方函数的参数
PEMS04_astgcn.conf
[Data]
adj_filename = ./data/PEMS04/distance.csv
graph_signal_matrix_filename = ./data/PEMS04/PEMS04.npz
num_of_vertices = 307
points_per_hour = 12
num_for_predict = 12
len_input = 12
dataset_name = PEMS04

[Training]
ctx = 0
in_channels = 1
nb_block = 2
K = 3
nb_chev_filter = 64
nb_time_filter = 64
batch_size = 32
model_name = astgcn_r
dataset_name = PEMS04
num_of_weeks = 0
num_of_days = 0
num_of_hours = 1
start_epoch = 0
epochs = 80
learning_rate = 0.001
loss_function = mse
metric_method = unmask
missing_value=0.0
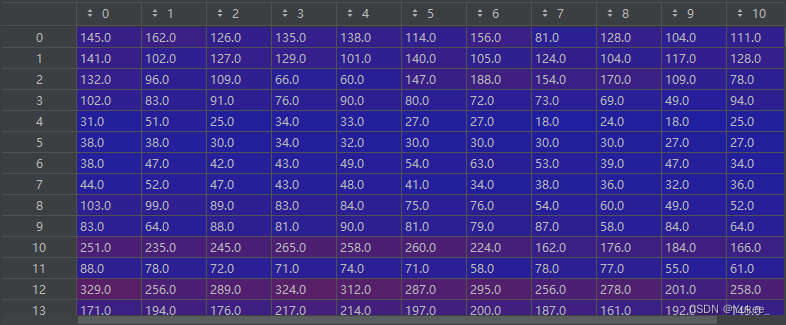
窗口思想:现在给我们的是16992条数据,要处理成我们所需要的格式,比如用一个小时的数据(12条)预测五分钟的(1条)
1个这样的矩阵(307×3)就是1条数据,一个窗口由多条这样的数据组成。
Debug看一下数据的情况
prepareData.py
 for idx in range(data_seq.shape[0]):
     sample = get_sample_indices(data_seq, num_of_weeks, num_of_days,#在这行打一个断点
以Debug状态运行prepareData.py
未出现预想结果,停止Debug
报错:
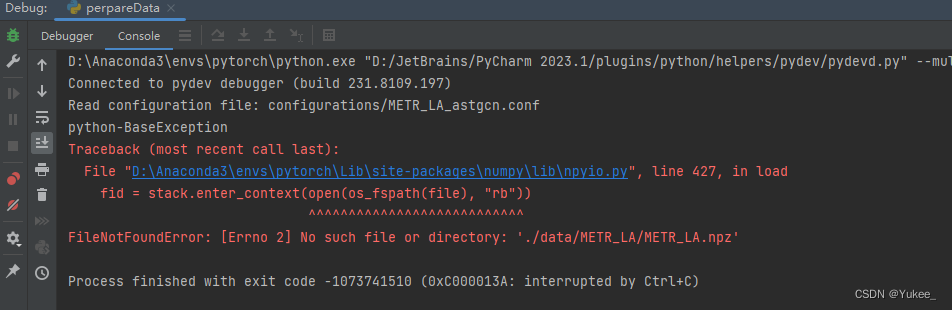
解决:
将270行(左右)处的
parser.add_argument("--config", default='configurations/METR_LA_astgcn.conf', type=str,
                    help="configuration file path")
改为
parser.add_argument("--config", default='configurations/PEMS04_astgcn.conf', type=str,
                    help="configuration file path")
继续Debug运行
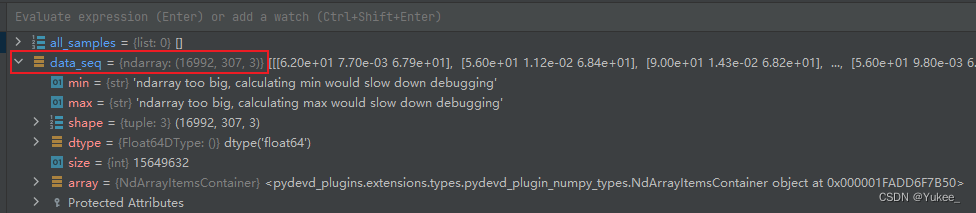
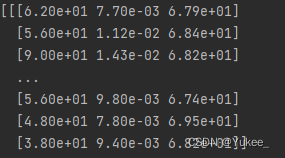
原始数据情况如图
构建窗口:
通过
prepareData.py
def get_sample_indices(data_sequence, num_of_weeks, num_of_days, num_of_hours,
                       label_start_idx, num_for_predict, points_per_hour=12):
    if label_start_idx + num_for_predict > data_sequence.shape[0]:#分界点的限制
        return week_sample, day_sample, hour_sample, None
    # return week_sample, day_sample, hour_sample, None=target
    if num_of_hours > 0:#构建一个小时的窗口
        hour_indices = search_data(data_sequence.shape[0], num_of_hours,
                                   label_start_idx, num_for_predict,
                                   1, points_per_hour)
函数构建窗口(组织sample):找一个分界点(label_start_idx),前面的记录作为x ,后面的若干记录作为y
label_start_idx有两个限制:
label_start_idx-12>=0——这里12是因为前面PEMS04_astgcn.conf中num_of_hours = 1,num_of_weeks = 0, num_of_days = 0label_start_idx+num_for_predict<数据总长度
prepareData.py功能流程
all_data = read_and_generate_dataset(graph_signal_matrix_filename, 0, 0, num_of_hours, num_for_predict,
                                     points_per_hour=points_per_hour, save=True)
调用read_and_generate_dataset函数
def read_and_generate_dataset(graph_signal_matrix_filename,
                              num_of_weeks, num_of_days,
                              num_of_hours, num_for_predict,
                              points_per_hour=12, save=False):
        for idx in range(data_seq.shape[0]):
        sample = get_sample_indices(data_seq, num_of_weeks, num_of_days,
                                    num_of_hours, idx, num_for_predict,
                                    points_per_hour)
idx:0~16994,为每个idx调用get_sample_indices
def get_sample_indices(data_sequence, num_of_weeks, num_of_days, num_of_hours,
                       label_start_idx, num_for_predict, points_per_hour=12):
        if num_of_hours > 0:
        hour_indices = search_data(data_sequence.shape[0], num_of_hours,
                                   label_start_idx, num_for_predict,
                                   1, points_per_hour)
        hour_sample = np.concatenate([data_sequence[i: j]
                                      for i, j in hour_indices], axis=0)

    target = data_sequence[label_start_idx: label_start_idx + num_for_predict]
def search_data(sequence_length, num_of_depend, label_start_idx,
                num_for_predict, units, points_per_hour):
                x_idx = []
    #选择多长时间(1周/1天/1个小时)作为训练数据
    for i in range(1, num_of_depend + 1):
        #从分界点减去前几周(天、小时)得到起始索引
        start_idx = label_start_idx - points_per_hour * units * i
        #结束位置:起始索引加上要预测的长度得到结束索引
        end_idx = start_idx + num_for_predict
        if start_idx >= 0:
            x_idx.append((start_idx, end_idx))#得到的索引就是预测所使用到的x。

        else:
            return None
units就是一周(天、小时)
label_start_idx - points_per_hour * units * i就是从分界点减去前几周(天、小时)得到起始索引
num_of_depend 就是PEMS04_astgcn.conf中的num_of_hours = 1,用过去的一个小时预测。
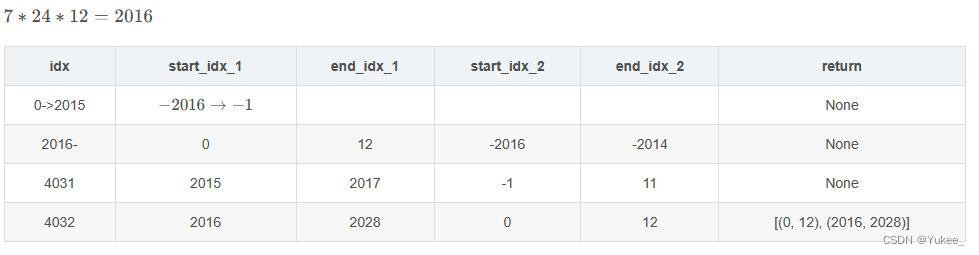
此函数返回的是原始数据中的索引,如链接: https://blog.youkuaiyun.com/panbaoran913/article/details/124332937?spm=1001.2014.3001.5502文章中的举例(下图),就是用过去两周的每周12条记录(一个小时)去预测。
下图中x_idx结果为[[0,12],[2016,2018]]的意识就是用过去第一周的一个小时的历史数据和过去第二周的一个小时的历史数据作为预测所使用的x,只不过现在得到的只是数据在原始序列中的索引。
y的索引就在x的基础上往后加:target = data_sequence[label_start_idx: label_start_idx + num_for_predict]
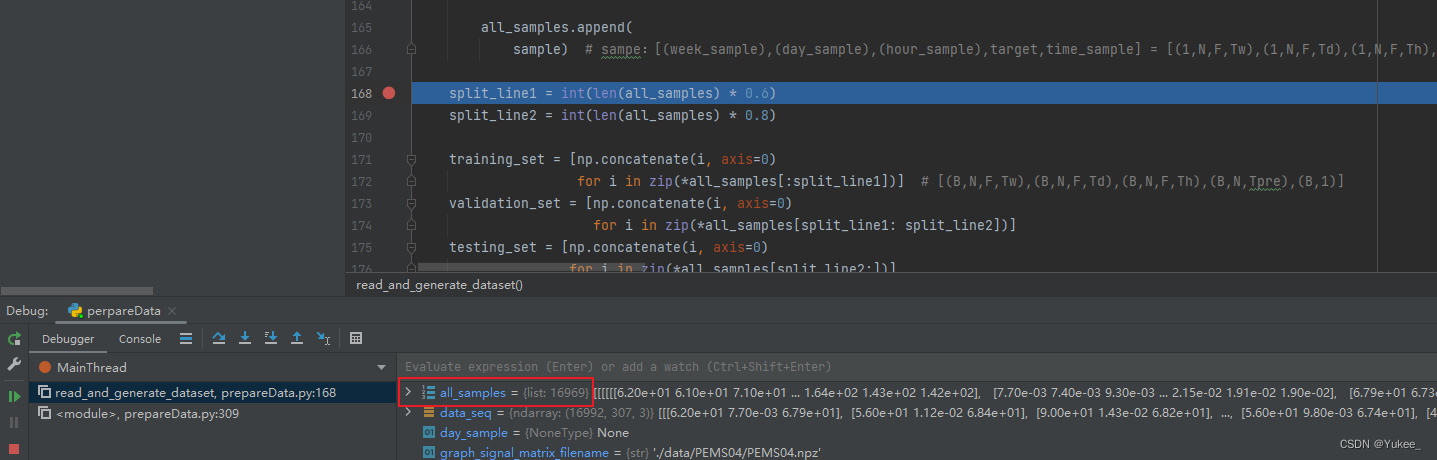
Debug发现all_sample相比原始数据少了24条,因为前12条和后12条不能作为索引,长度不够。
环境配置
运行train_ASTGCN_r.py报错
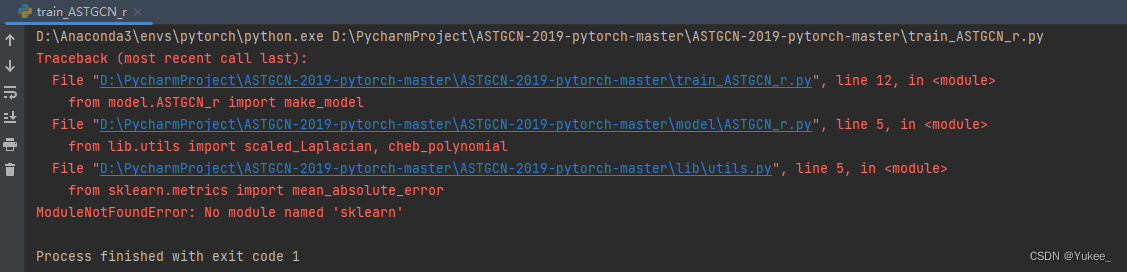
解决:
pip install sklearn
报错:
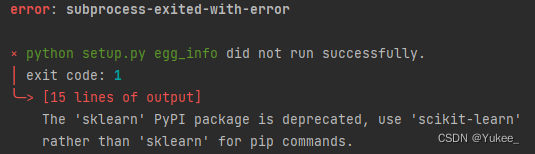
解决:
pip install scikit-learn
继续运行:
报错:
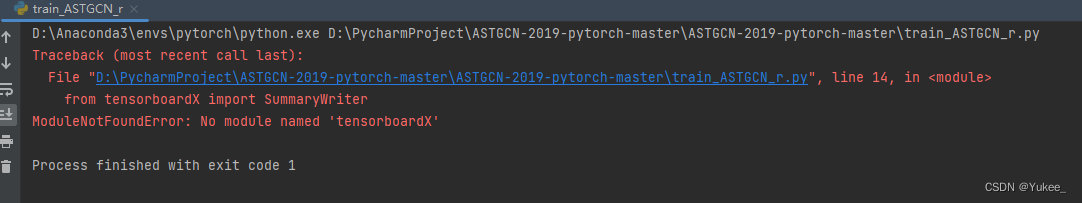
解决:
pip install tensorboardX
继续运行:
报错:

解决:
将

重命名为distance.csv
数据说明
train_targe:训练集的标签
[10181×307×12]-原始数据中前12条,10181=16992*60%,每次往后滑动一个索引取值。特征为流量。
关于数据生成部分更详细的解析可以看这篇文章: https://blog.youkuaiyun.com/Yukee_/article/details/140325814


 1504
1504

 被折叠的 条评论
为什么被折叠?
被折叠的 条评论
为什么被折叠?
 到【灌水乐园】发言


