


 本文介绍如何使用Python的Matplotlib库绘制带有图例的正弦和余弦曲线,并展示了如何设置图例的位置。通过具体代码示例,读者可以了解如何利用numpy生成数据点并使用Matplotlib进行可视化。
创建数据
import numpy as np
# 数据源(三角函数) ----------------------------------------
x = np.linspace(-np.pi, np.pi, 999)
cos_y = np.sin(x)
sin_y = np.cos(x) / 2
设置标签
- mp.plot(…, label=图例文本)
- mp.legend(loc=图例位置)
# 创建图形对象
import matplotlib.pyplot as mp
mp.figure(figsize=(np.pi * 3, 3))
# 设置标签名称【label】
mp.plot(x, cos_y, color='blue',
        label=r'$y=sin(x)$')
mp.plot(x, sin_y, color='red',
        label=r'$y=\frac{1}{2}cos(x)$')
# 设置标签位置【loc】
mp.legend(loc='upper left')
# 显示图形
mp.show()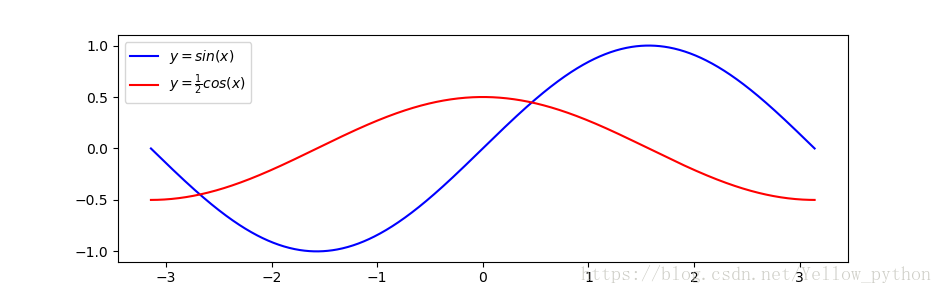


 4796
4796

 被折叠的 条评论
为什么被折叠?
被折叠的 条评论
为什么被折叠?
 到【灌水乐园】发言


