


 本文详细介绍了如何使用Matplotlib库进行绘图,包括输入列表或矩阵数据,展示图像,以及如何保存图像。通过实例展示了从列表到图像的转换过程,以及不同数据类型如NumPy数组在绘图中的应用。
- matplotlib
输入:列表或二维矩阵
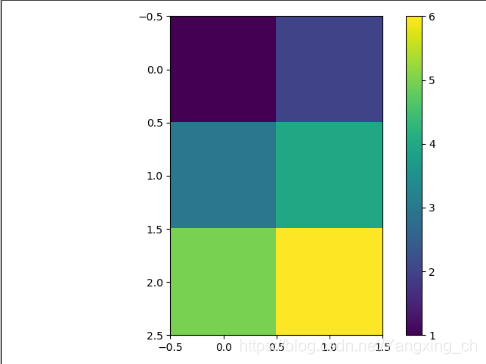
(1)例如列表:
#coding=utf-8
from matplotlib import pyplot as plt

X = [[1,2],[3,4],[5,6]]
plt.imshow(X)  #AxesImage(80,52.8;496x369.6)
plt.colorbar()
plt.show()  #导入AxesImage
结果输出:
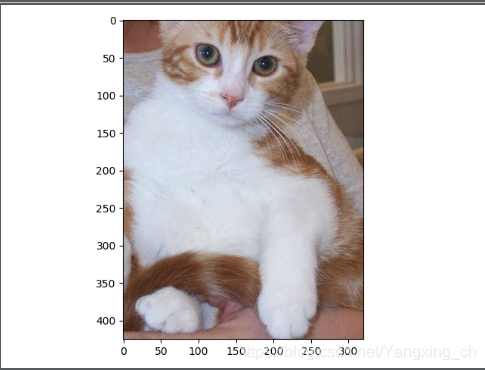
输入图片(实际也是列表):
from matplotlib import pyplot as plt#显示图片
from numpy import *
from matplotlib import image as mpimg#读取图片
I = mpimg.imread('cat.9.jpg')
print(type(I))#<class 'numpy.ndarray'>
plt.imshow(I)
plt.show()
输出结果:
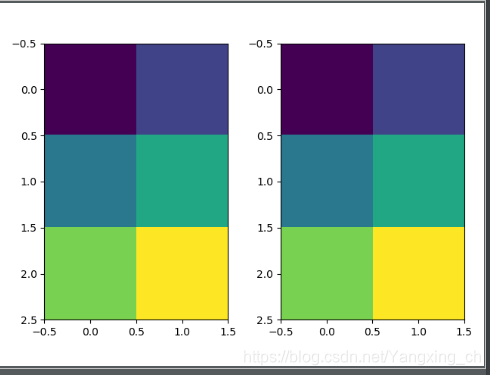
(2)输入矩阵
# coding=utf-8
from matplotlib import pyplot as plt
from numpy import *
X = [[1, 2], [3, 4], [5, 6]]
fig = plt.figure()#创建画布

print(type(X))#<class 'list'>
fig.add_subplot(121)
plt.imshow(X)

data = mat(X)
print(type(data))#<class 'numpy.matrix'>
fig.add_subplot(122)
plt.imshow(data)

plt.show()  # 导入AxesImage
输出结果:
保存
(1)使用savefig(图片名)
将要保存的图片放入AxesImage中。然后在show之前保存图片(否则会保存一张空白图)
from matplotlib import pyplot as plt
from numpy import *
X = [[1, 2], [3, 4], [5, 6]]
fig = plt.figure()#创建画布

print(type(X))#<class 'list'>
fig.add_subplot(121)
plt.imshow(X)


data = mat(X)
print(type(data))#<class 'numpy.matrix'>
fig.add_subplot(122)
plt.imshow(data)


plt.savefig('07.jpg')
plt.show()# 导入AxesImage
(2)使用imsave保存图片
from matplotlib import pyplot as plt
from numpy import *
X = [[1, 2], [3, 4], [5, 6]]
fig = plt.figure()#创建画布

print(type(X))#<class 'list'>
fig.add_subplot(121)
plt.imshow(X)


data = mat(X)
print(type(data))#<class 'numpy.matrix'>
fig.add_subplot(122)
plt.imshow(data)


plt.show()# 导入AxesImage
plt.imsave('08.jpg',data)


 557
557

 被折叠的 条评论
为什么被折叠?
被折叠的 条评论
为什么被折叠?
 到【灌水乐园】发言


