


传统车道线检测方法主要是使用颜色选择、高斯平滑、边缘检测、ROI区域选择、霍夫变换、标定车道边界等Opnecv图像处理操作去检测道路上的车道线,我自己对很多用这类处理对很多道路场景车道线进行过实验,这类算法往往需要人工根据不同街道场景手动去反复调整各算法参数,从而才能使检测效果最佳。
1 基于Opencv的车道线检测算法
这里还是提供我在学习过程中用到的检测代码,大家可以拿去做做测试:
import numpy as np
import cv2
import matplotlib.pyplot as plt
import matplotlib.image as mpimg
import math
from scipy import optimize
import os

# 颜色选择
def select_line_color(image):
    cvt_image = cv2.cvtColor(image, cv2.COLOR_RGB2HLS)  # COLOR_RGB2HSV   cv2.COLOR_RGB2HLS (# h l s)
    # yellow mask
    yellow_lower = np.uint8([50, 0, 20])  # h l s  10, 0, 100   26, 43, 46
    yellow_upper = np.uint8([100, 180, 40])  #      40, 255, 255  34, 255, 255
    yellow_mask = cv2.inRange(cvt_image, yellow_lower, yellow_upper)
    # white mask
    white_lower = np.array([0, 190, 0])     # 0, 200, 0  0, 0, 221
    white_upper = np.array([255, 255, 255])  #  255, 255, 255  180, 30, 255
    white_mask = cv2.inRange(cvt_image, white_lower, white_upper)
    # combine mask
    mask = cv2.bitwise_or(yellow_mask, white_mask)
    return cv2.bitwise_and(image, image, mask=mask)
# 彩色图像转为灰度图像
def grayscale(img):
    return cv2.cvtColor(img, cv2.COLOR_RGB2GRAY)
# 高斯平滑(去除噪声,平滑图像)
def gaussian_blur(img, kernel_size):
    return cv2.GaussianBlur(img, (kernel_size, kernel_size), 0)
# 边缘检测(利用Canny梯度,找到很多连成线的点)
def canny(img, low_threshold, high_threshold):
    return cv2.Canny(img, low_threshold, high_threshold)
# ROI区域选择
def region_of_interest(img, vertices):
    mask = np.zeros_like(img)  # 创建一个mask,形状与img相同,全为0值
    if len(img.shape) > 2:
        channel_count = img.shape[2]  # i.e. 3 or 4 depending on your image
        ignore_mask_color = (255,) * channel_count
    else:
        ignore_mask_color = 255
    cv2.fillPoly(mask, vertices, ignore_mask_color)  # 对mask进行填充,做一个掩码,vertices区域为1,其余为0
    masked_image = cv2.bitwise_and(img, mask)
    return masked_image
# 霍夫变换
def hough_lines(img, rho, theta, threshold, min_line_len, max_line_gap):
    lines = cv2.HoughLinesP(img, rho, theta, threshold, np.array([]), minLineLength=min_line_len, maxLineGap=max_line_gap)  # 输出四个元素矢量,分别是线段的起点和终点
    line_img = np.zeros((img.shape[0], img.shape[1], 3), dtype=np.uint8)  # 全黑的图片
    draw_lines(line_img, lines)  # 在全黑的图片上画霍夫检测出来的直线
    return line_img
# 画线
def draw_lines(img, lines, color=[255, 0, 0], thickness=2):  # 在一张图片上画霍夫检测出来的直线
    for line in lines:
        for x1, y1, x2, y2 in line:
            cv2.line(img, (x1, y1), (x2, y2), color, thickness)
# 叠加图像,配置两张图片的权重值
def weighted_img(img, initial_img, α=0.8, β=1., λ=0.):
    return cv2.addWeighted(initial_img, α, img, β, λ)
# 车道左右边界标定
def calculate_lines(img, lines):
    left = []
    right = []  # 建立两个空列表,用于存储左右车道边界坐标
    for line in lines:  # 循环遍历lines line:[[600 379 875 537]]
        x1, y1, x2, y2 = line.reshape(4)  # 将线段信息从二维转换到一维 x1:600 x2:875 y1:379 y2:537
        parameters = np.polyfit((x1, x2), (y1, y2), 1)  # 将一个线性多项式拟合到x和y坐标上,并返回一个描述斜率和y轴截距的系数向量(其实就是计算这条线的斜率和截距)
        slope = parameters[0]  # 斜率
        y_intercept = parameters[1]  # 截距
        if slope < 0:  # 通过斜率大小,可以判断式左边界还是右边界(注意cv坐标系不同的)
            left.append((slope, y_intercept))
        else:
            right.append((slope, y_intercept))
    left_avg = np.average(left, axis=0)  # 将所有左边界和右边界做平均,分别得到一条直线的斜率和截距
    right_avg = np.average(right, axis=0)
    left_line = calculate_coordinate(img, parameters=left_avg)  # 将两条线的截距和斜率值转换为x1,y1,x2,y2
    right_line = calculate_coordinate(img, parameters=right_avg)
    line_img = np.zeros((img.shape[0], img.shape[1], 3), dtype=np.uint8)  # 全黑的图片
    draw_lines1(line_img, left_line)
    draw_lines1(line_img, right_line)
    return line_img
# 将截距与斜率转换为cv空间坐标
def calculate_coordinate(img, parameters):
    slope, y_intercept = parameters  # 获取斜率与截距
    y1 = img.shape[0]  # 设置初始y坐标为自顶向下(框架底部)的高度
    y2 = int(y1 - 260)   # 将最终的y坐标设置为框架底部上方240处  该值越大左右两条画出来的车道线越容易相交
    # 根据y1=kx1+b,y2=kx2+b求取x1,x2
    x1 = int((y1 - y_intercept) / slope)
    x2 = int((y2 - y_intercept) / slope)
    return np.array([[x1, y1, x2, y2]])
# 可视化车道线
def draw_lines1(img, line, color=[0, 0, 255], thickness=  10):  # 在一张图片上画霍夫检测出来的直线
    if line is not None:
        for x1, y1, x2, y2 in line:
            cv2.line(img, (x1, y1), (x2, y2), color, thickness)
            # cv2.imshow("calculate_lines", img)
# sobel边缘检测
def abs_sobel_thresh(image, orient, sobel_kernel, thresh):
    gray = cv2.cvtColor(image, cv2.COLOR_RGB2GRAY)  # 转化成灰度图像
    if orient == 'x':  # 求X或Y方向的方向梯度
        abs_sobel = np.absolute(cv2.Sobel(gray, cv2.CV_64F, 1, 0, ksize=sobel_kernel))
    if orient == 'y':
        abs_sobel = np.absolute(cv2.Sobel(gray, cv2.CV_64F, 0, 1, ksize=sobel_kernel))
    scaled_sobel = np.uint8(255*abs_sobel/np.max(abs_sobel))   # 数据重新缩放
    grad_binary = np.zeros_like(scaled_sobel)  # 创建一个空矩阵,黑图片
    grad_binary[(scaled_sobel >= thresh[0]) & (scaled_sobel <= thresh[1])] = 1  # 梯度在阈值范围内的,图片点亮
    return grad_binary


# 读取视频
cap = cv2.VideoCapture(VEDIO_LOCATION)  # 视频读取
while (cap.isOpened()):  # 当视频还是打开的时候,循环遍历每一帧
    ret, frame = cap.read()
    # if ret:
    #     cv2.imshow("frame", frame)
        # cv2.imwrite('test_images/1_image_raw_compressed.jpg', frame)
        # break
    line_color = select_line_color(frame)
    # cv2.imshow("line_color", line_color)
    img_gray = grayscale(line_color)

    # gradx = abs_sobel_thresh(line_color, orient='x', sobel_kernel=15, thresh=(30, 90))  # 30, 90
    # grady = abs_sobel_thresh(line_color, orient='y', sobel_kernel=15, thresh=(30, 90))
    # imgs = np.hstack([gradx, grady])
    # plt.imshow(imgs)
    # plt.show()

    img_blur = gaussian_blur(img_gray, 5)
    vertices = np.array([[(0, 480), (0, 300), (640, 300), (640, 480)]], dtype=np.int32)  # 道路左边
    img_masked = region_of_interest(img_blur, vertices)
    img_edge = canny(img_masked, low_threshold=50, high_threshold=150)
    cv2.imshow("canny", img_edge)

    # 不检测左右车道线
    img_lined1 = hough_lines(img_masked, rho=2, theta=np.pi / 180, threshold=15, min_line_len=15, max_line_gap=5)
    # cv2.imshow("hough_lines", img_lined1)
    img_weighted1 = weighted_img(img_lined1, frame, α=0.8, β=1., λ=0.)
    cv2.imshow("img_weighted1", img_weighted1)

    # # 检测左右车道线
    # lines = cv2.HoughLinesP(img_masked, rho=2, theta=np.pi / 180, threshold=20, minLineLength=20, maxLineGap=5)
    # img_lined2 = calculate_lines(img_masked, lines)
    # # cv2.imshow("calculate_lines", img_lined2)
    # img_weighted1 = weighted_img(img_lined2, frame, α=0.8, β=1., λ=0.)
    # cv2.imshow("img_weighted1", img_weighted1)

    if cv2.waitKey(10) & 0xff == ord('q'):  # q键退出
        break
cap.release()
cv2.destroyAllWindows()
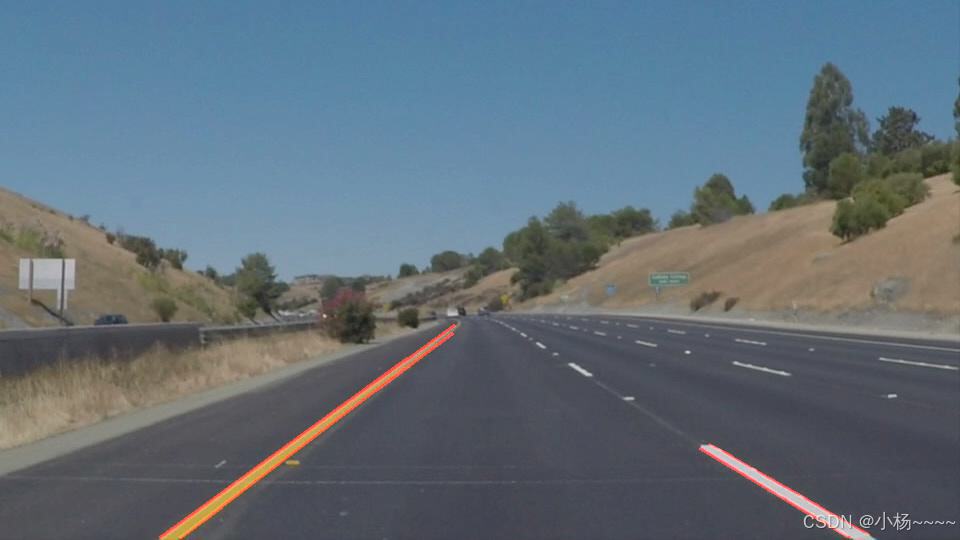
2 车道线检测效果
场景1
场景2(ROS小车)
写一下把检测脚本放到小车上的步骤:
- 先在catkin_ws/src下新建一个功能包并编译:
cd /home/bingda/catkin_ws/
catkin_make
cd src
catkin_create_pkg lane_detection roscpp rospy std_msgs
cd /home/bingda/catkin_ws/- 创建测试py文件
cd /home/bingda/catkin_ws/src/lane_detection/
touch script #新建script文件用来存放pyhon文件
cd /home/bingda/catkin_ws/src/lane_detection/script/
touch demo.py
chmod +x demo.py- 编译工作空间
catkin_make -DCATKIN_WHITELIST_PACKAGES=lane_detection
或者
catkin_make --pkg lane_detection source devel/setup.bash- 运行检测脚本
cd /home/bingda/catkin_ws/src/lane_detection/script/
python demo.py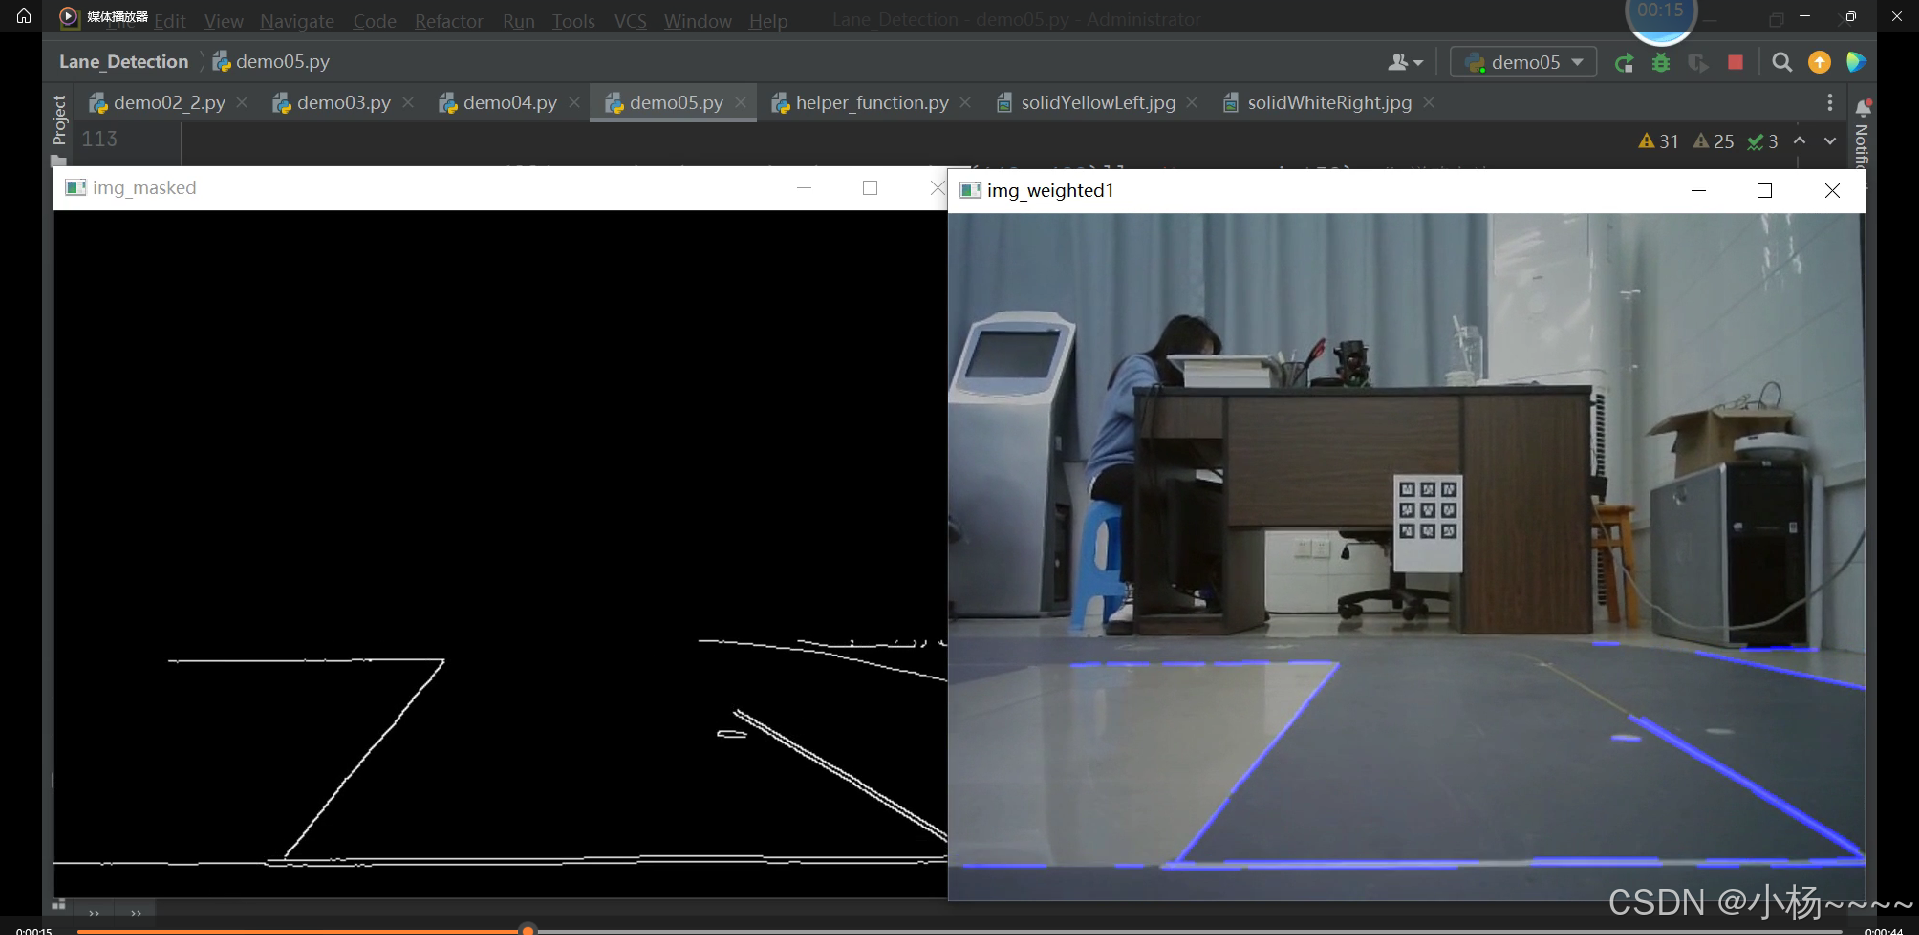


 989
989

 被折叠的 条评论
为什么被折叠?
被折叠的 条评论
为什么被折叠?
 到【灌水乐园】发言


