


 本文介绍了matplotlib库中的六边形分箱图,这种图表用于二维直方图,通过六边形箱子展示数据点的分布,颜色深浅表示数据密度。
一、引言
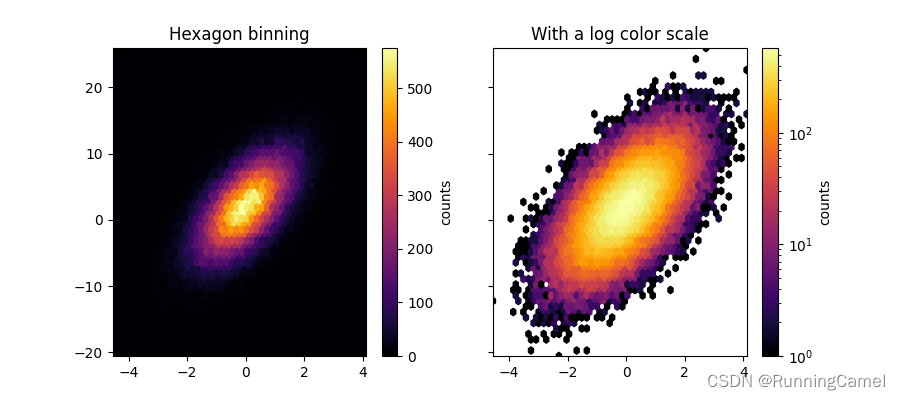
hexbin是一个二维直方图,其中箱子是六边形,颜色表示每个箱子内的数据点数。
二、实例介绍
import matplotlib.pyplot as plt
import numpy as np

# Fixing random state for reproducibility
np.random.seed(19680801)

n = 100_000
x = np.random.standard_normal(n)
y = 2.0 + 3.0 * x + 4.0 * np.random.standard_normal(n)
xlim = x.min(), x.max()
ylim = y.min(), y.max()

fig, (ax0, ax1) = plt.subplots(ncols=2, sharey=True, figsize=(9, 4))

hb = ax0.hexbin(x, y, gridsize=50, cmap='inferno')
ax0.set(xlim=xlim, ylim=ylim)
ax0.set_title("Hexagon binning")
cb = fig.colorbar(hb, ax=ax0, label='counts')

hb = ax1.hexbin(x, y, gridsize=50, bins='log', cmap='inferno')
ax1.set(xlim=xlim, ylim=ylim)
ax1.set_title("With a log color scale")
cb = fig.colorbar(hb, ax=ax1, label='counts')

plt.show()
E
N
D
!
\color{#4285f4}{\mathbf{E}}\color{#ea4335}{\mathbf{N}}\color{#fbbc05}{\mathbf{D}}\color{#4285f4}{\mathbf{!}}
END!


 3771
3771

 被折叠的 条评论
为什么被折叠?
被折叠的 条评论
为什么被折叠?
 到【灌水乐园】发言


