


1.subplot 函数
语法:
subplot(m,n,p)
subplot可以把图分为多个子图,由m和n决定分成多个个绘制区域,p是指定当前活动区。
>> subplot(2,2,1)
>> x=linspace(0,2*pi,60);
>> y=sin(x);
>> plot(x,y);
>> title('sin(x)');
>> axis([0,2*pi,-1,1]);
>> x=linspace(0,2*pi,60);
>> subplot(2,2,2);
>> plot(x,sin(x)-1);
>> title('sin(x)-1');
>> axis([0 2*pi -2 0]);
>> subplot(2,2,3)
>> plot(x,tan(x))
>> title('tan(x)')
>> subplot(2,2,4)
>> plot(x,cot(x))
>> title('cot(x)')
>> axis([0 2*pi -35 35])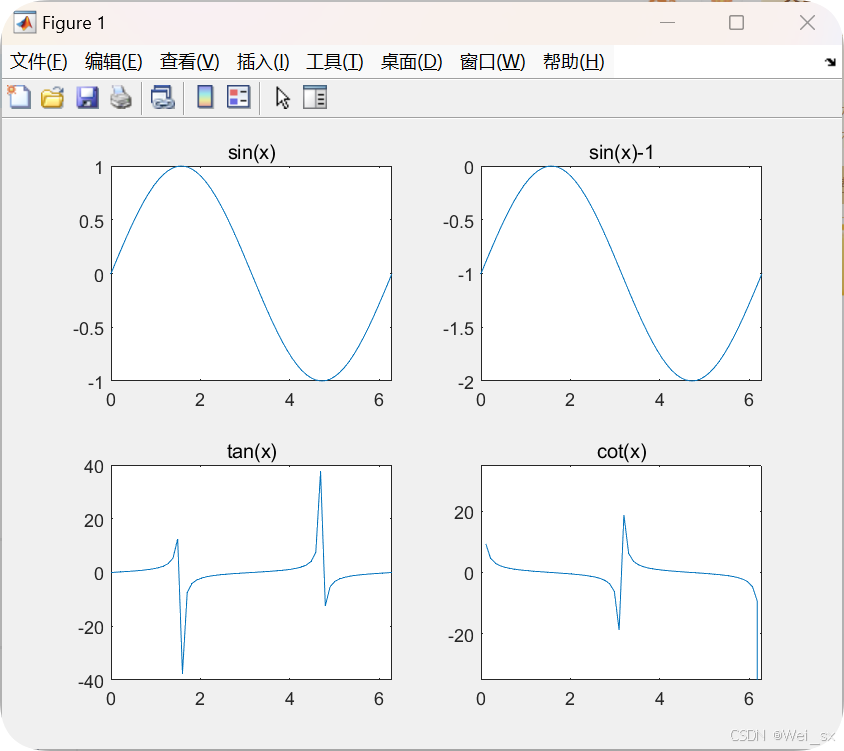


 被折叠的 条评论
为什么被折叠?
被折叠的 条评论
为什么被折叠?
 到【灌水乐园】发言


