


 该代码片段展示了如何利用numpy、pandas和scipy库中的genextreme函数对数据进行拟合,计算不同年份(如5年、10年等)的回归期水平。它首先读取数据,然后拟合广义极值分布,最后计算并打印出各个回归期对应的水位。

借助此文方法
# -*- coding: utf-8 -*-
"""
@Features of this code:重现期
@Author: zlf
@Date:
"""
import numpy as np
import pandas as pd
from scipy.stats import genextreme
def return_periods(data, years=[5, 10, 20, 50, 100]):
data = np.array(data) # data为ndarray格式
# Fit the generalized extreme value distribution to the data.
shape, loc, scale = genextreme.fit(data)
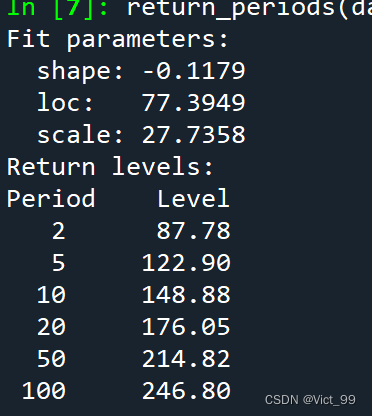
print("Fit parameters:")
print(f" shape: {shape:.4f}")
print(f" loc: {loc:.4f}")
print(f" scale: {scale:.4f}")
# Compute the return levels for several return periods.
return_periods = np.array(years)
return_levels = genextreme.isf(1 / return_periods, shape, loc, scale)
print("Return levels:")
print("Period Level")
for period, level in zip(return_periods, return_levels):
print(f'{period:4.0f} {level:9.2f}')
if __name__ == '__main__':
data = pd.read_excel(r'D:\降水量.xlsx')
return_periods(data)
————————————————
版权声明:本文为优快云博主「毛发浓密的猿工」的原创文章,遵循CC 4.0 BY-SA版权协议,转载请附上原文出处链接及本声明。
原文链接:https://blog.youkuaiyun.com/weixin_46604505/article/details/107231556
-------------------------------
测试:
csv文件读取
da=pd.read_csv(r'D:\t3.csv',header=None)
data=pd.DataFrame(da)
return_periods(data, years=[2,5, 10, 20, 50, 100])


 1186
1186

 被折叠的 条评论
为什么被折叠?
被折叠的 条评论
为什么被折叠?
 到【灌水乐园】发言


