


 本文介绍了一种使用Python和PyQt5实现的城市温度数据处理和可视化方法,包括数据读取、处理、展示及用户交互功能。
Introduction
Programming environment
programming language: python 3.7
OS: Mac OS
Main Package : PyQt5, csv, matplotlib
Project structure
dataset
数据集是一个csv文件,总共有14个城市,也就是14个csv文件。文件样例是
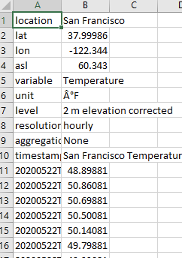
前十行是城市的具体信息,从11行开始,第一列是时间信息,第二列是温度信息。时间信息格式为YYYYMMDDTHHmm。就是年月日小时分钟,中间用T做分隔符。
数据处理部分
用python 的csv包进行处理,主要包括三个函数,读取路径下所有csv文件。做法:
def listdir(path, list_name):
	for file in os.listdir(path):
		file_path = os.path.join(path, file)
		if(os.path.splitext(file_path)[1] == '.csv'):
			list_name.append(file_path)
然后就是从csv中读取city name 和关于city的data。我将city的信息和气温信息放在了一起,后期可以分开。
def getData(file, cityName, city_data):
	csvFile = open(file, "r")
	reader = csv.reader(csvFile)
	result = {}
	for item in reader:
		if reader.line_num == 1:
			city = item[1]
			cityName.append(item[1])
			result[item[0]] = item[1]
		else:
			result[item[0]] = item[1]

	city_data[city] = result
	csvFile.close()
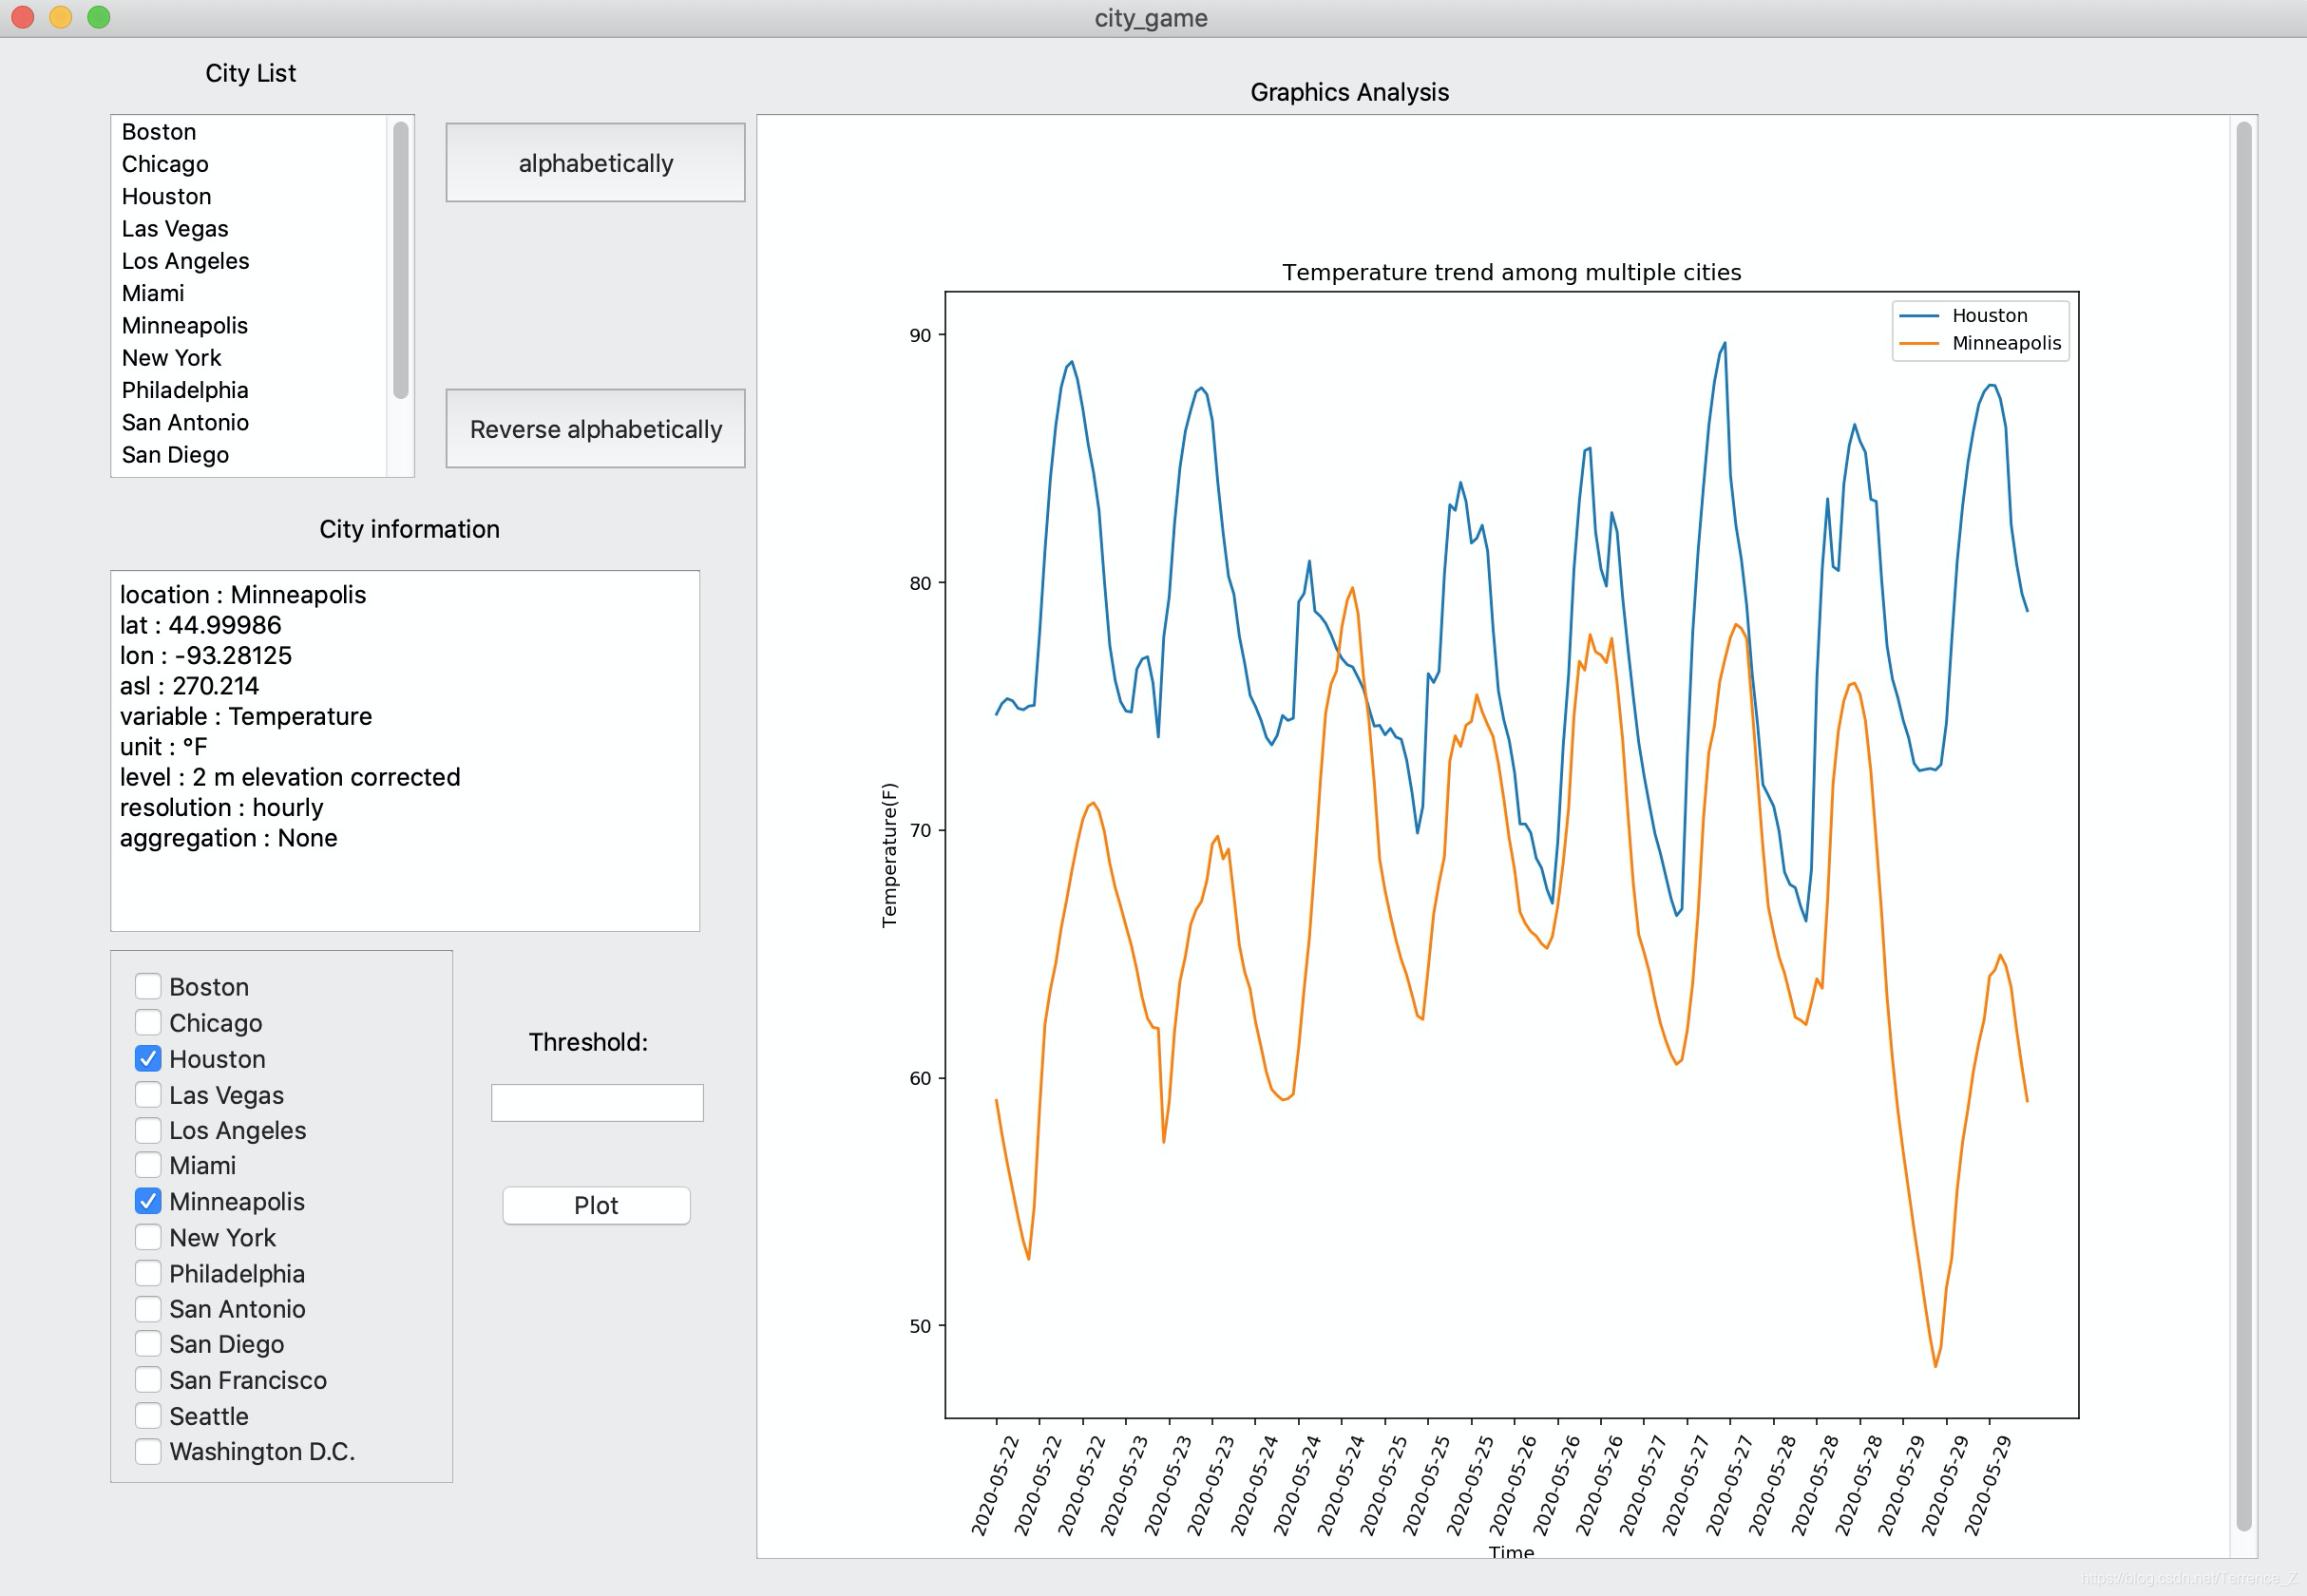
Project Goal
- 展现city name的list,并让用户能逆序和顺序展示city list。
- 通过选择城市,能展示该城市的温度随时间变化曲线。并要求能满足多城市的情况,也就是同时展现多个城市的曲线。
- 能让用户设置阈值,来展现城市温度曲线中,小于阈值的点。
UI design
I use PyQt to design the interface. 一开始因为PyQt5在mac环境下没有qt designer。一开始我尝试了qt for designer 也就是pyside2,但那个界面并不是很友好而且我mac安装pyside2-tools有问题,所以我用了qt creator。
主要用到的控件是:
Label 标签
PushButton 按钮
TextBrowser 文本框
Graphics view 图片显示
Scroll area 滚动区域
checkbox 多选框
line edit 可编辑文本框(单行)
这是成图。
在ui设计完之后,我们在QT Creator中得到的是一个.ui文件,我们需要用
pyuic5 -o fileName.py fileName.ui
指令来将ui文件转换为py文件,以方便后续逻辑的设计。
界面和业务逻辑设计要分开。所以UI界面单独做一个文件,业务逻辑文件单独拎出来,import UI文件就可。
控件说明和用法:
控件的创建在qt creator中比较简单,就是直接拖拽组件到mainframe中即可。在右边窗口要记得定义好组件的名字,在之后的代码设计逻辑时要用到,不然指向会不明确。
LIst View:
QList_View的信号有两种,clicked和doubleClicked 分别表示单击和双击时触发。
setModel方法可以用来设置View所关联的模型,可以使用Python原生的list作为数据源model
 #实例化列表模型,添加数据
 slm=QStringListModel()
 self.qList=['Item 1','Item 2','Item 3','Item 4']

 #设置模型列表视图,加载数据列表
 slm.setStringList(self.qList)

 #设置列表视图的模型
 listview.setModel(slm)

 #单击触发自定义的槽函数
 listview.clicked.connect(self.clicked)
参考:
https://blog.youkuaiyun.com/jia666666/article/details/81624550
QPushButton
有四种信号
void clicked ( bool checked = false )
void pressed ()
void released ()
void toggled ( bool checked )
信号用法
QPushButton.clicked.connect(function)
这样信号就连接了一个function,如果点击按钮,就会检测到信号,并触发函数function.
https://blog.youkuaiyun.com/qter_wd007/article/details/6618386
QLineEdit
作为单行文本框控件,可以编辑单行字符串,用于接受用户输入,与QTextEdit不同,QTextEdit是多行文本框控件。
用法:
QLineEdit.text()就能获得文本,返回字符串。如果没有输入的时候,返回""
https://blog.51cto.com/9291927/2422601
QCheckBox
这里用了遍历CheckBox的方法:
for i in range(1, 14):
	temp = getattr(self, "checkBox_%d"%i)
	if temp.checkState():
		checkbox_state.append(1)
		num = num + 1
	else:
		checkbox_state.append(0)
temp代表每个CheckBox,然后用内置函数.checkState()返回是否选中。
内置方法:
设置复选框的状态
setChecked()
返回复选框的显示文本
text()
检查复选框是否被选中
isChecked()
https://blog.youkuaiyun.com/jia666666/article/details/81533763
ScrollArea用法
作为一个容器,可以将一些Widget放入其中,然后进行管理。他是一个可以滚动查看的一个容器。但是内容都是放在他下面的scrollAreaWidgetContents中的。
TextBrowser
TextBrowser用法
TextBrowser.setText()和TextBrowser.clear()
Graphics View
https://zhuanlan.zhihu.com/p/26379590
https://whuhan2013.github.io/blog/2017/03/28/pyqt-matplotlib-learn/
https://my.oschina.net/u/4275236/blog/3354339
https://www.coder.work/article/4956997
这个部分主要与Matplotlib结合,放在下一部分说明。
matplotlib作图部分
结合PyQt5 和matPlotLib
首先关于matplotlib要引用的包有
import matplotlib
matplotlib.use("Qt5Agg")  # 声明使用QT5
from matplotlib.backends.backend_qt5agg import FigureCanvasQTAgg as FigureCanvas
from matplotlib.figure import Figure
这里用matplotlib.backends.backend_qt5agg来连接PyQt5
class Figure_Canvas(FigureCanvas):
	def __init__(self, parent=None, width=11, height=11, dpi=70):
		fig = Figure(figsize=(width, height), dpi=70)

		FigureCanvas.__init__(self,fig)
		self.setParent(parent)

		self.ax = fig.add_subplot(111)

	def generate(self, xs, ys, num, c, thresold=''):
		if(num == 1):
			self.ax.cla()
			self.ax.xaxis.set_major_formatter(mdates.DateFormatter('%Y%m%dT%H%M'))
			self.ax.xaxis.set_major_locator(mdates.DayLocator())
			x = range(len(xs))
			self.ax.set_title('Temperature over time of %s'%c[0])
			self.ax.set_xlabel('Time')
			self.ax.set_ylabel('Temperature(F)')
			self.ax.set_xticks(x[::8])
			self.ax.set_xticklabels(xs[::8], rotation=70)
			self.ax.plot(x, ys, label='%s'%c[0])
			self.ax.legend(loc='upper right')
			if thresold is not '':
				x, y_sc = self.pointsFilter(thresold, xs, ys, num)
				self.ax.scatter(x, y_sc, s=40, alpha=0.7)

		else:
			self.ax.cla()
			self.ax.xaxis.set_major_formatter(mdates.DateFormatter('%Y%m%dT%H%M'))
			self.ax.xaxis.set_major_locator(mdates.DayLocator())
			x = range(len(xs[0]))
			self.ax.set_title('Temperature trend among multiple cities')
			self.ax.set_xlabel('Time')
			self.ax.set_ylabel('Temperature(F)')
			self.ax.set_xticks(x[::8])
			self.ax.set_xticklabels(xs[0][::8], rotation=70)
			for i in range(num):
				self.ax.plot(x, ys[i], label='%s'%c[i])
			self.ax.legend(loc='upper right')
			if thresold is not '':
				x, y_sc = self.pointsFilter(thresold, xs, ys, num)
				for i in range(num):
					self.ax.scatter(x[i], y_sc[i], s=40, alpha=0.7)


	def pointsFilter(self, thresold, xs, ys, num):
		x_sc = []
		y_sc = []
		if (num == 1):
			for i in range(len(ys)):
				if ys[i] < float(thresold):
					y_sc.append(ys[i])
					x_sc.append(i)
		else:
			for i in range(num):
				x_tmp = []
				y_tmp = []
				for j in range(len(ys[i])):
					if ys[i][j] < float(thresold):
						x_tmp.append(j)
						y_tmp.append(ys[i][j])
				x_sc.append(x_tmp)
				y_sc.append(y_tmp)
		return x_sc, y_sc
这里初始化fig为Figure(figsize=(width, height), dpi=70)。dpi是分辨率。宽高这种都可以调整来适应放入的graphics view。而且这个figure并不是pyplot下的。
通过继承FigureCanvas类,使得该类既是一个PyQt5的Qwidget,又是一个matplotlib的FigureCanvas,这是连接pyqt5与matplotlib的关键。
class Mytest(QMainWindow):
    def __init__(self, *args, **kwargs):
        super().__init__(*args, **kwargs)
        # 设置窗口标题
        self.setWindowTitle('My First App')
        self.setFixedSize(800, 600)

        # ===通过graphicview来显示图形
        self.graphicview = QtWidgets.QGraphicsView()  # 第一步,创建一个QGraphicsView
        self.graphicview.setObjectName("graphicview")

        dr = Figure_Canvas()
        #实例化一个FigureCanvas
        dr.test()  # 画图
        graphicscene = QtWidgets.QGraphicsScene()  # 第三步,创建一个QGraphicsScene,因为加载的图形(FigureCanvas)不能直接放到graphicview控件中,必须先放到graphicScene,然后再把graphicscene放到graphicview中
        graphicscene.addWidget(dr)  # 第四步,把图形放到QGraphicsScene中,注意:图形是作为一个QWidget放到QGraphicsScene中的
        self.graphicview.setScene(graphicscene)  # 第五步,把QGraphicsScene放入QGraphicsView
        self.graphicview.show()  # 最后,调用show方法呈现图形!Voila!!
        self.setCentralWidget(self.graphicview)
        self.graphicview.setFixedSize(800,600)

if __name__ == '__main__':
    app = QApplication(sys.argv)
    mytest=Mytest()

    mytest.show()
    app.exec_()
作图问题
- 时间间隔作为横坐标
因为时间间隔变量与整型浮点型等不同,所以需要进行转换才能使其作为横坐标。
以下是例子,非正式代码内容
from datetime import datetime
import matplotlib.dates as mdates
import matplotlib.pyplot as plt

dates = ['2016010106','2016010107','2016010108','2016010109','2016010110','2016010111','2016010112','2016010113',
         '2016010114','2016010115','2016010116','2016010117','2016010118']
#把string格式的日期转换成datetime格式
xs = [datetime.strptime(d, '%Y%m%d%H') for d in dates]
ys = ['36','29','26','22','29','38','48','55','56','60','55','48','51']

fig = plt.figure()
ax = fig.add_subplot(1,1,1)
#指定X轴的以日期格式(带小时)显示
ax.xaxis.set_major_formatter(mdates.DateFormatter('%Y%m%d%H'))
#X轴的间隔为小时
ax.xaxis.set_major_locator(mdates.HourLocator())
plt.plot(xs, ys)
plt.gcf().autofmt_xdate()
plt.show()
这里用到一个函数datetime.strptime(),用这个函数需要from datetime import datetime.
这其实是对dates中的值进行遍历,然后通过strptime做转换,第二个参数需要对数据进行解读,比如说%Y%m%d%H就是代表年月日小时。
这里还要用到ax.xaxis.set_major_formatter(mdates.DateFormatter(’%Y%m%d%H’))来指定x轴的以日期格式显示。
然后设置x轴的间隔为小时。
ax.xaxis.set_major_locator(mdates.HourLocator())。
这里还对温度进行了小数点的截取。
for y in temperature[0]:
	ys.append(float(y.split('.')[0] + '.' + y.split('.')[1][:2]))
https://blog.youkuaiyun.com/shener_m/article/details/81047862
- 横坐标太过密集
对于这个问题我用了
self.ax.set_xticks(x[::8])
self.ax.set_xticklabels(xs[::8], rotation=70)
横坐标实际用了x,也就是原来的横坐标的长度作为横坐标,因为原来的时间坐标,间隔也都是以同样长度,2小时为单位,就不会影响比例。然后通过选择每八个坐标选择一个显示,同时设置rotation旋转为70度,让坐标显示斜过来,以使坐标显示不重叠。
-
axes作图与pyplot不同
用法基本相同,除了函数名有些不同,在axes中都是set_xlabel之类,但pyplot中是plt.xlabel. -
点波动过高,不够连续
将x轴改为用时间序列的长度作为总长度,间隔为1的数列即可。
python 打包应用程序
最后python的打包方式,我用的是pyinstaller,经历了重重险阻才打包成可运行的程序,主要遇到两个问题:
- 打包好的程序运行不了,存在module not found的问题,提示pkg_resources.py2_warn。这个module not found。
解决方法是:
在.spec文件中,更改hiddenimports参数,加入"pkg_resources.py2_warn"
- 数据集无法使用。说是dataset not found
这个问题困扰了很久,尝试的办法有1.更改.spec的data参数。修改的用法是,(原项目中资源文件路径,打包后路径),也就是["./dataset", “./dataset”],第二个尝试的办法,是在引用数据集的代码中添加如下代码,然后每次file_path传入的时候改为resource_path(file_path)。然后问题就得到了解决。
import os
import sys
def resource_path(relative_path):
    """ Get absolute path to resource, works for dev and for PyInstaller """
    base_path = getattr(sys, '_MEIPASS', os.path.dirname(os.path.abspath(__file__)))
    return os.path.join(base_path, relative_path)
参考博客:
https://blog.youkuaiyun.com/m0_37477175/article/details/82146996
https://blog.youkuaiyun.com/weixin_42052836/article/details/82315118


 1982
1982

 被折叠的 条评论
为什么被折叠?
被折叠的 条评论
为什么被折叠?
 到【灌水乐园】发言


