


 这篇博客展示了如何使用MATLAB的subplot和image函数在一个窗口内展示两幅图像,包括原始图片和其灰度热力图,并附带了详细步骤和代码实例。
该例子来源于matlab官网
This is an example of how to display multiple images in a subplot in MATLAB®.
有关同一图像窗口显示多幅图片的例子。
Read about the image function in the MATLAB documentation.
请阅读matlab参考文档中中相关的image函数
For more examples, go to MATLAB Plot Gallery
相应的阅读,请点击链接。
% Read the data for the original image------第一幅图像的输入和名字的定义及其来源(地址)
original = imread('ngc6543a.jpg');
% Create the first image display using the image command -----使用matlab命令行 显示该图像
figure
subplot(1, 2, 1)%详见https://cn.mathworks.com/help/matlab/ref/subplot.html#btw1t4b-2_1
image(original)
axis square
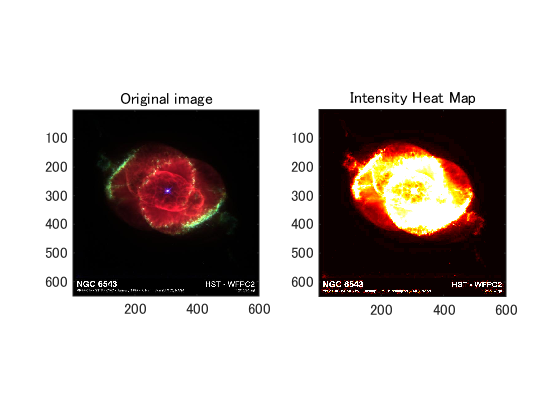
% Add title for first image----该图像的标题(注意是图像的标题)
title('Original image')
% Create the data for the second image----同理如上
heatmap = mean(original, 3);%对图像进行求值
% Create the second image display using the image command
subplot(1, 2, 2)
image(heatmap)
colormap(hot)
original = imread('ngc6543a.jpg');
% Create the first image display using the image command -----使用matlab命令行 显示该图像
figure
subplot(1, 2, 1)%详见https://cn.mathworks.com/help/matlab/ref/subplot.html#btw1t4b-2_1
image(original)
axis square
% Add title for first image----该图像的标题(注意是图像的标题)
title('Original image')
% Create the data for the second image----同理如上
heatmap = mean(original, 3);%对图像进行求值
% Create the second image display using the image command
subplot(1, 2, 2)
image(heatmap)
colormap(hot)%详见色图函数https://baike.baidu.com/link?url=8lq7P6O17bSdgtx3YszRlYfWOVqffBEa21Hj-FlO31n0tUe8TehHEIWK69-oGygSB4vitgRDRNI9fW8f6jwhSw_NINfeDnNMp4Gv7nwNKse
axis square
% Add title for the second image
title('Intensity Heat Map')
axis square
% Add title for the second image
title('Intensity Heat Map')


 1749
1749


 到【灌水乐园】发言


