mapbox动图marker

贴个群号

WebGIS学习交流群461555818,欢迎大家。
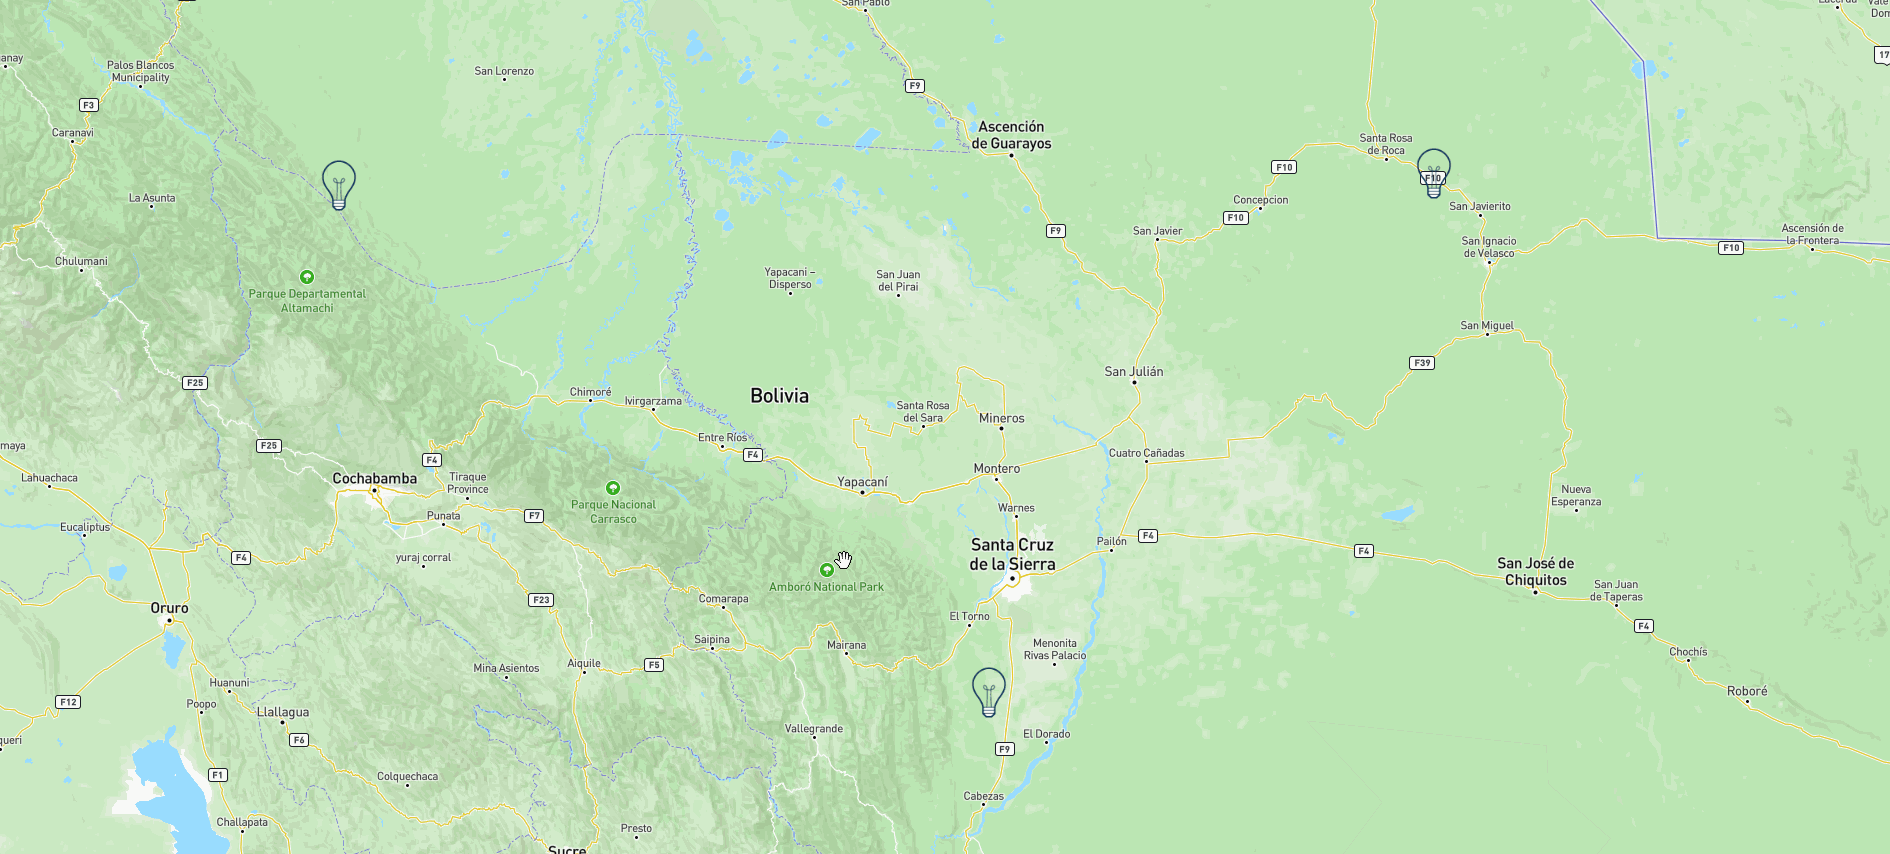
成果图

在这里插入图片描述

实现

该例子参考的是mapbox的这个官方例子

https://docs.mapbox.com/mapbox-gl-js/example/geojson-markers/

本来想用symbol的那个方式去写,结果发现gif的图标不行,想实现这种效果,
似乎只能采用marker的写法,但是marker的这个确实不太好操作,似乎没有layer的概念,留待以后学习,再回来改,这里是源码:

<!DOCTYPE html>
<html>
<head>
<meta charset="utf-8">
<title>Add custom icons with Markers</title>
<meta name="viewport" content="initial-scale=1,maximum-scale=1,user-scalable=no">
<link href="https://api.mapbox.com/mapbox-gl-js/v2.15.0/mapbox-gl.css" rel="stylesheet">
<script src="https://api.mapbox.com/mapbox-gl-js/v2.15.0/mapbox-gl.js"></script>
<style>
body { margin: 0; padding: 0; }
#map { position: absolute; top: 0; bottom: 0; width: 100%; }
</style>
</head>
<body>
<style>
    .marker {
        display: block;
        border: none;
        border-radius: 50%;
        cursor: pointer;
        padding: 0;
    }
</style>

<div id="map"></div>

<script>
	mapboxgl.accessToken = 'pk.eyJ1Ijoic2FrdXJhc2p5IiwiYSI6ImNsOThtZnd2bDBya2Qzd212aXdzcTJyNjcifQ.CFg6DX03N25sPliiIyjnmQ';
    const geojson = {
        'type': 'FeatureCollection',
        'features': [
            {
                'type': 'Feature',
                'properties': {
                    'message': 'Foo',
                    'iconSize': [60, 60]
                },
                'geometry': {
                    'type': 'Point',
                    'coordinates': [-66.324462, -16.024695]
                }
            },
            {
                'type': 'Feature',
                'properties': {
                    'message': 'Bar',
                    'iconSize': [50, 50]
                },
                'geometry': {
                    'type': 'Point',
                    'coordinates': [-61.21582, -15.971891]
                }
            },
            {
                'type': 'Feature',
                'properties': {
                    'message': 'Baz',
                    'iconSize': [40, 40]
                },
                'geometry': {
                    'type': 'Point',
                    'coordinates': [-63.292236, -18.281518]
                }
            }
        ]
    };

    const map = new mapboxgl.Map({
        container: 'map',
        // Choose from Mapbox's core styles, or make your own style with Mapbox Studio
        style: 'mapbox://styles/mapbox/streets-v12',
        center: [-65.017, -16.457],
        zoom: 5
    });

    // Add markers to the map.
    for (const marker of geojson.features) {
        // Create a DOM element for each marker.
        const el = document.createElement('div');
        el.className = 'marker';
        el.style.backgroundImage = `url(http://www.sucaijishi.com/uploadfile/2015/1215/20151215110434556.gif)`;
        el.style.width = '100px';
        el.style.height = '100px';
        el.style.backgroundSize = '100%';

        el.addEventListener('click', () => {
            window.alert(marker.properties.message);
        });

        // Add markers to the map.
        new mapboxgl.Marker(el)
            .setLngLat(marker.geometry.coordinates)
            .addTo(map);
    }
</script>

</body>
</html>
Mapbox 中实现 Marker 的高亮效果可以通过多种方式来完成,具体取决于你希望高亮的交互方式和视觉表现。以下是一些常见的实现方法: ### 1. 使用 `Popup` 或 `Marker` 的悬停效果 你可以通过监听地上的鼠标事件(如 `mouseenter` 和 `mouseleave`)来态改变 Marker 的样式,从而实现高亮效果。 ```javascript // 假设已经初始化了 map 并添加了一个标记层 map.on('mouseenter', 'marker-layer-id', function () { // 改变光标样式 map.getCanvas().style.cursor = 'pointer'; // 更改 marker 标或大小以实现高亮 map.setLayoutProperty('marker-layer-id', 'icon-size', 1.5); // 放大标 }); map.on('mouseleave', 'marker-layer-id', function () { map.getCanvas().style.cursor = ''; map.setLayoutProperty('marker-layer-id', 'icon-size', 1); // 恢复原始大小 }); ``` ### 2. 使用自定义 HTML 元素作为 Marker 并实现 CSS 画 如果你使用的是基于 DOM 的 Marker(即 `new mapboxgl.Marker(element)`),则可以利用 CSS 来实现更丰富的高亮画效果。 ```html <!-- 自定义 Marker 元素 --> <div id="marker" class="highlightable-marker"></div> ``` ```css .highlightable-marker { width: 20px; height: 20px; background-color: red; border-radius: 50%; transition: transform 0.3s ease, background-color 0.3s ease; } .highlightable-marker:hover { transform: scale(1.5); background-color: yellow; } ``` ```javascript // 创建自定义 Marker const marker = new mapboxgl.Marker(document.getElementById('marker')) .setLngLat([longitude, latitude]) .addTo(map); ``` ### 3. 使用 GeoJSON 数据源并态更新样式 如果你使用的是 GeoJSON 数据源来渲染 Marker,可以通过修改数据源的属性来态更改样式。 ```javascript map.addLayer({ 'id': 'highlighted-markers', 'type': 'symbol', 'source': 'markers-source', 'layout': { 'icon-image': '{icon}-15', 'icon-size': ['case', ['==', ['get', 'highlighted'], true], 1.5, 1] // 高亮时放大 } }); // 在某个事件中触发高亮 function highlightMarker(id) { const features = map.querySourceFeatures('markers-source', { sourceLayer: 'your-source-layer', filter: ['==', 'id', id] }); if (features.length > 0) { features[0].properties.highlighted = true; map.getSource('markers-source').setData(yourGeoJsonData); // 更新数据源以触发重绘 } } ``` ### 4. 使用 `circle` 层叠加实现高亮效果 你还可以在点击或悬停某个 Marker 时,态地在其周围添加一个圆形高亮层。 ```javascript map.addLayer({ 'id': 'highlight-circle', 'type': 'circle', 'source': { 'type': 'geojson', 'data': { 'type': 'FeatureCollection', 'features': [] } }, 'paint': { 'circle-radius': 20, 'circle-color': '#f00', 'circle-opacity': 0.5 } }); // 当用户悬停在某个 Marker 上时显示高亮圆圈 map.on('mouseenter', 'marker-layer-id', function (e) { const coordinates = e.features[0].geometry.coordinates; const highlightSource = map.getSource('highlight-circle'); highlightSource.setData({ 'type': 'FeatureCollection', 'features': [{ 'type': 'Feature', 'geometry': { 'type': 'Point', 'coordinates': coordinates } }] }); }); // 离开时清除高亮 map.on('mouseleave', 'marker-layer-id', function () { map.getSource('highlight-circle').setData({ 'type': 'FeatureCollection', 'features': [] }); }); ``` 以上方法可以根据你的具体需求进行组合和调整,以实现更加复杂的交互式高亮效果。 ---
评论 1
成就一亿技术人!
拼手气红包6.0元
还能输入1000个字符
 
红包 添加红包
表情包 插入表情
 条评论被折叠 查看
添加红包

请填写红包祝福语或标题

红包个数最小为10个

红包金额最低5元

当前余额3.43前往充值 >
需支付:10.00
成就一亿技术人!
领取后你会自动成为博主和红包主的粉丝 规则
hope_wisdom
发出的红包
实付
使用余额支付
点击重新获取
扫码支付
钱包余额 0

抵扣说明:

1.余额是钱包充值的虚拟货币,按照1:1的比例进行支付金额的抵扣。
2.余额无法直接购买下载,可以购买VIP、付费专栏及课程。

余额充值