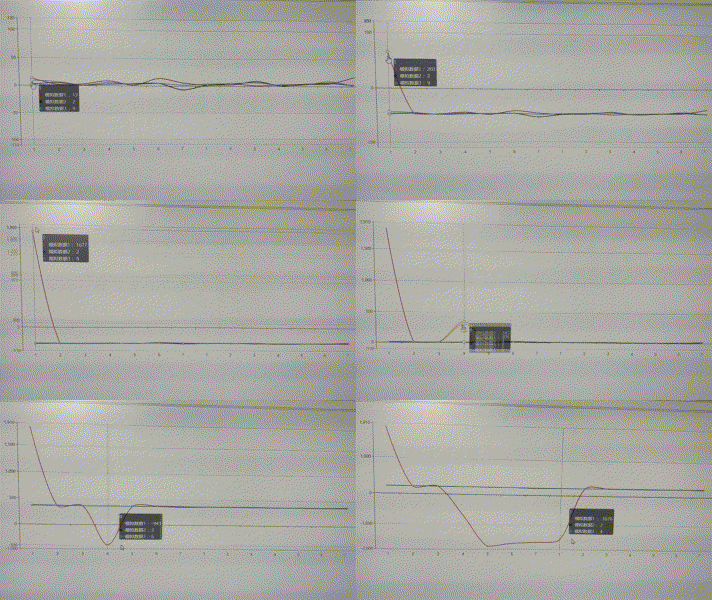
有不懂的,可以留言哈,
<!DOCTYPE html>
<html style="height: 100%">

<head>
    <meta charset="utf-8">
</head>

<body style="height: 100%; margin: 0">
<!-- <p>12</p>
<p>12</p>
<p>12</p>
<p>12</p>
<p>12</p>
<p>12</p> -->
    <div id="container" style="height: 80%"></div>
    <script src="../echarts.min.js"></script>
    <script src="../jquery-1.12.4.min.js"></script>
    <script type="text/javascript">
        var dom = document.getElementById("container");
        var myChart = echarts.init(dom);
        option = null;
        option = {
            tooltip: {
                trigger: 'axis',
                borderColor: 'red',  //鼠标移动到图上面时,背景色
                padding: 0,     //定义内边距
                formatter: function (params) {//params存的是对应的y轴数据
                    if (down) {
                        var bl = (h - 40 - 80) / (max-min);//比例尺
                        var v=((h - 60 - y) / bl).toFixed(0)*1;//实际高度
                        console.log('params[0].value',v*1+min ,params);
                        option.series[0].data[params[0].dataIndex] = v+min;
                        myChart.setOption(option);
                    }
                    var showHtm="";
                    showHtm=params[0].axisValue+'<br>';
                    for(var i=0;i<params.length;i++){
                        var name = params[i].seriesName;//名称
                        var value = params[i].value;//值
                        showHtm+=params[i].marker + " " +name+ ' :'+value+ " " +'<br>'
                    }
                    return showHtm;
                }
            },
            xAxis: {
                type: 'category',
                data: ['1', '2', '3', '4', '5', '6', '7', '1', '2', '3', '4', '5', '6', '7']
            },
            yAxis: {
                type: 'value',
                max: function(value) {
                    max=Math.round((value.max+100)/10)*10 ;
                    return max;
                },
                min: function(value) {
                    min=Math.floor((value.min-100)/10)*10 ;
                    return min;
                }
            },
            series: [{
                name:'模拟数据1',
                data: [1, 2, 3, 9, 1, 14, 6, 2, 5, 1, 3, 4, 5, 17],
                type: 'line',
                smooth: true
            }, {
                name:'模拟数据2',
                data: [2, 5, 1, 3, 4, 5, -7, 2, 3, 9, 1, 4, 6, 2],
                type: 'line',
                smooth: true
            }, {
                name:'模拟数据3',
                data: [9, 7, 1, 6, 3, 5, 2, 4, 5, 7, 2, 3, 9, 1],
                type: 'line',
                smooth: true
            }]
        };
        ;

        myChart.setOption(option);

        var canva = document.getElementsByTagName('canvas')[0];
        var canvas = $('canvas');
        var x, y;
        var h = canvas.height();
        var down = false;
        function getLocation(x, y) {
            var bbox = canva.getBoundingClientRect();
            return {
                x: (x - bbox.left) * (canva.width / bbox.width),
                y: (y - bbox.top) * (canva.height / bbox.height)
            };
        }
        canvas.on('mousemove', function (e) {
            var location = getLocation(e.clientX, e.clientY);//忽略canvas临近标签的干扰
            // y = e.clientY;
            y = location.y;
            console.log('y: ',location.y)
        })

        canvas.on('mousedown', function (e) {
            down = true;
        })
        canvas.on('mouseup', function (e) {
            down = false;
        })
    </script>
</body>

</html>


 本文介绍了一个使用ECharts实现的数据可视化示例,包括如何通过JavaScript动态更新图表数据,并添加了鼠标悬停时显示提示信息的功能。该示例还演示了如何响应鼠标点击事件来调整数据值。


 1032
1032

 被折叠的 条评论
为什么被折叠?


