


 在新调试器中查看内存ID,可以通过点击NewTool或ReplaceTool选择SystemAreas(InternalOnly),然后在MEMORIES区域中查看。或者,切换到经典调试器,通过Goto,SystemAreas,ABAPMemory来显示。若要查看PARAMETERS,需打开SMEM区域。
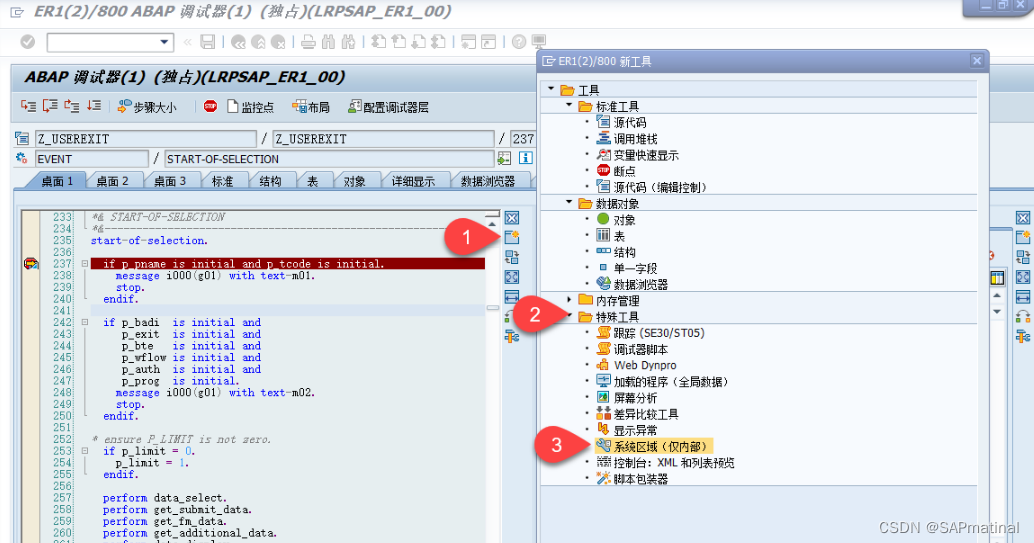
These memory IDs can be accessed in the debugger, but the option isn't accessible by default in the "new" Debugger. To display them you have two options:
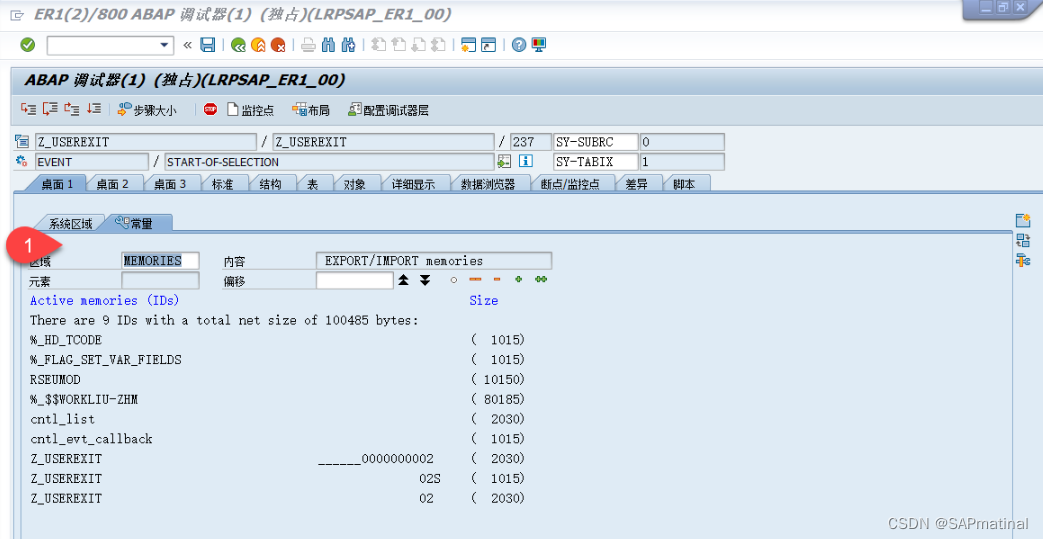
- In the new Debugger, change one of the tools you're using. Do this by clicking the "New Tool" or "Replace Tool" that you can see at the top of the vertical button column on the right of each subwindow. Open the Special Tools folder in the tree and select "System Areas (Internal Only)". In the second tab of this tool you can now see a list of areas. Double-click the MEMORIES("EXPORT/IMPORT memories") area or manually enter it in the Area input field to open the list of active memory IDs. Click through on any one to see its hexadecimal value.
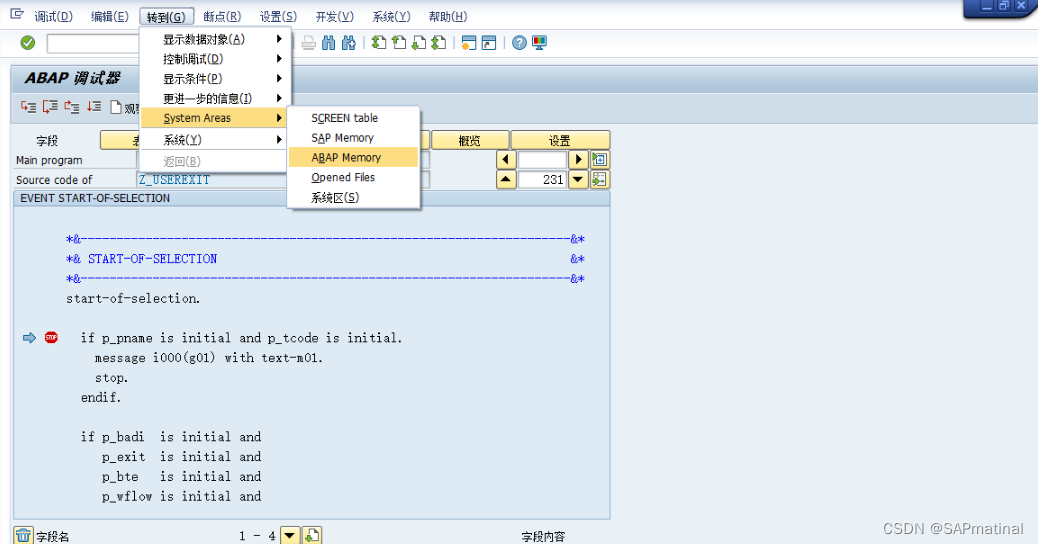
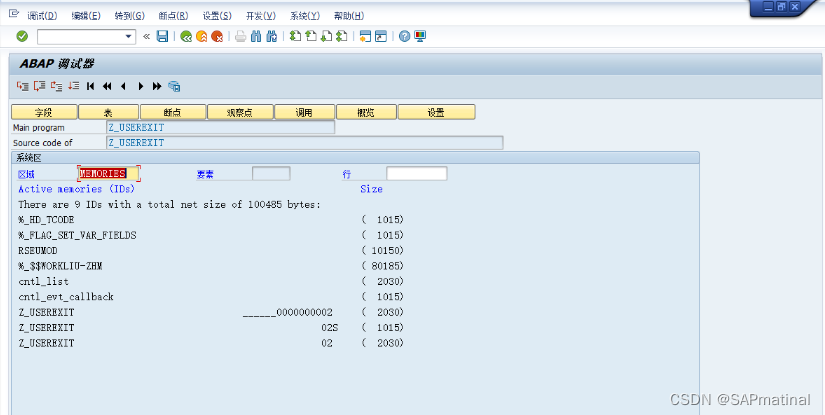
- In the menu bar, open Debugger and select "Switch to Classic Debugger". Once it opens, find the following in the menu bar: Goto, System Areas, ABAP Memory. The system areas will be displayed with the MEMORIES area selected by default.
Parameters
If you want to view the PARAMETERs that were set instead of memory IDs, the procedure is almost exactly the same. However, instead of opening the MEMORIES system area, open the SMEM ("SAP memory (SPA-GPA)") area.


 271
271

 被折叠的 条评论
为什么被折叠?
被折叠的 条评论
为什么被折叠?
 到【灌水乐园】发言


