


 本文主要介绍如何使用Python的Matplotlib库中的bar()函数创建条形图,包括其基本用法和运行示例。
title: Matplotlib - bar(条形图)
categories:
- python
- Matplotlib
tags: - python
- Matplotlib
- Computer Drawing
主要内容:bar()生成条形图
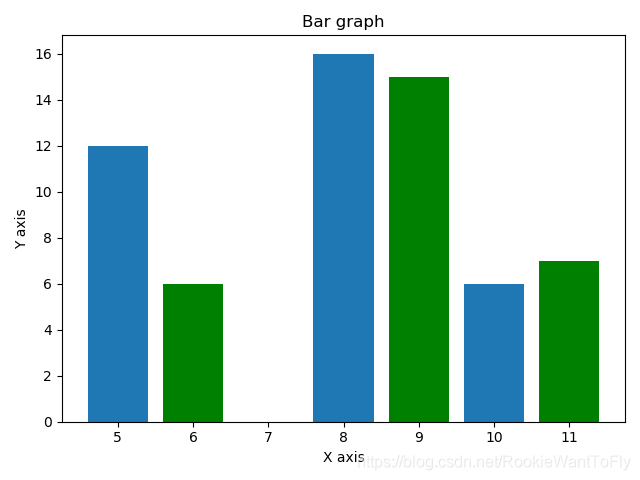
pyplot子模块提供bar()函数来生成条形图
from matplotlib import pyplot as plt

x = [5, 8, 10]
y = [12, 16, 6]
x_2 = [6, 9, 11]
y_2 = [6, 15, 7]

plt.bar(x, y,align='center')
# 换颜色 green
plt.bar(x_2, y_2, color='g', align='center')
plt.title("Bar graph")
plt.ylabel("Y axis")
plt.xlabel("X axis")
plt.show()
运行结果:


 2506
2506

 被折叠的 条评论
为什么被折叠?
被折叠的 条评论
为什么被折叠?
 到【灌水乐园】发言


