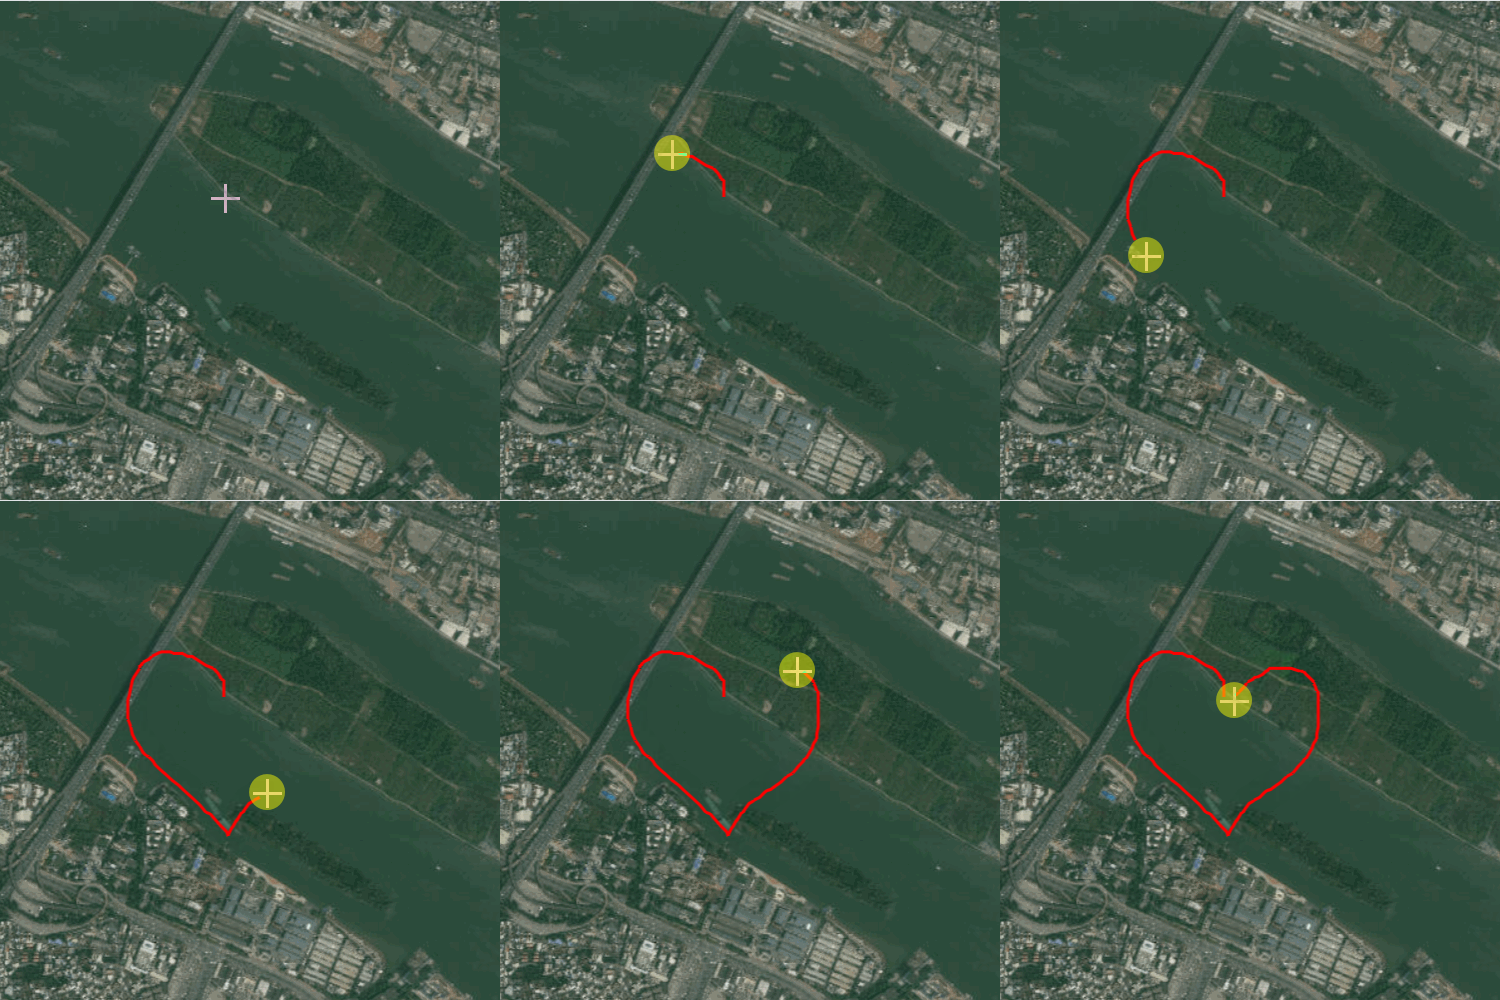
前言
Mapbox GL JS 版本:3.6.0
虽然这篇博客写的是 Mapbox GL JS,但是如果您真的需要在实际项目中实现这个功能,可以考虑直接用 OpenLayers 来实现:OpenLayers Freehand Drawing

实现
/**
 * @description: 绘制曲线
 */
export class DrawCurve {
  nodeCoordinateList; // 节点坐标
  lineFeatureCollection; // 线GeoJSON集合
  constructor(map, callback) {
    this.map = map;
    this.addPoint = this.addPoint.bind(this);
    this.end = this.end.bind(this);
    this.dynamicAction = this.dynamicAction.bind(this);

    this.callback = callback; // 回调函数
  }
  // 初始化图层
  init() {
    // 添加线图层
    this.map.addLayer({
      id: "_lineLayer2",
      type: "line",
      source: {
        type: "geojson",
        data: this.lineFeatureCollection,
      },
      paint: {
        "line-color": "#ff0000",
        "line-width": 2,
        "line-opacity": 1,
      },
    });
  }

  // 重置数据
  reset() {
    this.nodeCoordinateList = [];
    this.lineFeatureCollection = {
      type: "FeatureCollection",
      features: [],
    };
  }

  // 开始测量
  start() {
    this.reset();
    this.init();

    this.map.dragPan.disable(); // 禁止双击缩放
    this.map.getCanvas().style.cursor = "crosshair"; // 设置鼠标样式

    this.map.on("mousedown", this.addPoint);
    this.map.on("mouseup", this.end);
    this.map.on("mousemove", this.dynamicAction);
  }

  // 结束绘制
  end() {
    this.map.off("mousedown", this.addPoint);
    this.map.off("mouseup", this.end);
    this.map.off("mousemove", this.dynamicAction);

    this.map.getCanvas().style.cursor = ""; // 恢复鼠标样式
    this.callback && this.callback(this.nodeCoordinateList);
  }

  // 清除绘制
  clear() {
    this.map.dragPan.enable(); // 恢复双击缩放
    this.map.off("mousedown", this.addPoint);
    this.map.off("mouseup", this.end);
    this.map.off("mousemove", this.dynamicAction);
    this.map.getCanvas().style.cursor = ""; // 恢复鼠标样式

    if (this.map.getSource("_lineLayer2")) {
      this.map.removeLayer("_lineLayer2");
      this.map.removeSource("_lineLayer2");
    }
  }

  // 隐藏绘制
  show(flag) {
    if (flag) {
      this.map.setLayoutProperty("_lineLayer2", "visibility", "visible");
    } else {
      this.map.setLayoutProperty("_lineLayer2", "visibility", "none");
    }
  }

  // 添加点
  addPoint(e) {
    const lngLat = [e.lngLat.lng, e.lngLat.lat];
    this.nodeCoordinateList.push(lngLat);
  }

  // 鼠标移动事件
  dynamicAction(e) {
    const lngLat = [e.lngLat.lng, e.lngLat.lat];
    const lineList = this.lineFeatureCollection;
    const len = this.nodeCoordinateList.length;

    if (this.nodeCoordinateList.length > 0) {
      this.nodeCoordinateList.push(lngLat);
      let prev = this.nodeCoordinateList[len - 1];
      lineList.features.push({
        type: "Feature",
        geometry: {
          type: "LineString",
          coordinates: [prev, lngLat],
        },
      });
      this.map.getSource("_lineLayer2").setData(lineList);
    }
  }
}
使用方法
import { DrawCurve } from "./map/index.js"; // 引入

// 实例化
const drawVector = new DrawCurve(map, (data) => {
  console.log('绘制完毕后的回调', data);
});

// 开始绘制
drawVector.start();

// 结束并清除绘制结果
drawVector.clear();
最后
这边有简单的画线和画面:【WebGIS实例】(18)MapboxGL 绘制矢量——线、面


 4269
4269

 被折叠的 条评论
为什么被折叠?


