 半监督学习提升分类准确率:TSVM与SVM对比


 该作业探讨了半监督学习中的TSVM算法,通过对比仅使用有标记样本的SVM,展示了TSVM如何利用无标记样本提高分类准确率。在iris数据集上,TSVM相比于SVM的预测正确率从96.67%提升到98.33%,并在测试集上达到100%的准确率。此外,还介绍了混合专家模型生成的数据下,如何推导生成式半监督学习算法。
《机器学习》之《半监督学习》作业
《机器学习》之《半监督学习》作业
题目1
从网上下载或自己编程实现TSVM算法 选择两个UCI数据集,将其中30%的样例用作测试样本,10%的样例用作有标记样本,60%的样例用作无标记样本。分别训练出利用无标记样本的TSVM以及仅利用有标记样本的SVM,并比较其性能。
解:
选择最常用的iris数据集,将数据集标准化之后,将其中30个样例用作测试样本,10个样例用作有标记样本,60个样例用作无标记样本。以sklearn的SVM算法为基础建立TSVM。模型训练好后,输出经过有标记的样本训练后对未标记样本的预测正确率、经过TSVM训练后,对未标记样本的预测正确率和经过TSVM训练后对测试样本的预测正确率。最后绘制散点图和分别由SVM和TSVM得到的超平面。代码如下:
import matplotlib.pyplot as plt
import numpy as np
import pandas as pd
from sklearn import svm
from sklearn.datasets import load_iris
from sklearn.preprocessing import MinMaxScaler


def create_data():
    iris = load_iris()
    df = pd.DataFrame(iris.data, columns=iris.feature_names)
    df['label'] = iris.target
    df.columns = ['sepal length', 'sepal width', 'petal length', 'petal width', 'label']
    data = np.array(df.iloc[:100, [0, 1, -1]])
    # 对数据进行标准化处理
    sc = MinMaxScaler()
    sc.fit(data)
    data = sc.transform(data)
    data[:, -1] = data[:, -1] * 2 - 1
    # 30个测试样本
    test = np.vstack((data[:15], data[50:65]))
    # 10个有标记样本
    labeled_sample = np.vstack((data[15:20], data[65:70]))
    # 60个无标记样本
    unlabeled_sample = np.vstack((data[20:50], data[70:]))
    return test, labeled_sample, unlabeled_sample


test, labeled, unlabeled = create_data()
clf = svm.SVC(C=1, kernel='linear')
# 有标记的样本训练SVM
clf.fit(labeled[:, :2], labeled[:, -1])
positive_labeled = labeled[5:]
negative_labeled = labeled[:5]
plt.scatter(labeled[:5, :2][:, 0], labeled[:5, :2][:, 1], color='red', s=40, label=-1)
plt.scatter(labeled[5:, :2][:, 0], labeled[5:, :2][:, 1], color='blue', s=40, label=1)
x_points = np.linspace(0, 1, 10)
y_points = -(clf.coef_[0][0] * x_points + clf.intercept_) / clf.coef_[0][1]
plt.plot(x_points, y_points, color='green')
plt.legend()
# 伪标记
fake_label = clf.predict(unlabeled[:, :2])
unlabeled_positive_x = []
unlabeled_positive_y = []
unlabeled_negative_x = []
unlabeled_negative_y = []
for i in range(len(unlabeled)):
    if int(fake_label[i]) == 1:
        unlabeled_positive_x.append(unlabeled[i, 0])
        unlabeled_positive_y.append(unlabeled[i, 1])
    else:
        unlabeled_negative_x.append(unlabeled[i, 0])
        unlabeled_negative_y.append(unlabeled[i, 1])

plt.scatter(unlabeled_positive_x, unlabeled_positive_y, color='red', s=15)
plt.scatter(unlabeled_negative_x, unlabeled_negative_y, color='blue', s=15)
print('经过有标记的样本训练后,对未标记样本的预测正确率为{}'.format(clf.score(unlabeled[:, :2], unlabeled[:, -1])))

Cu = 0.1
Cl = 1  # 初始化Cu,Cl
weight = np.ones(len(labeled) + len(unlabeled))
# 样本权重
weight[len(unlabeled):] = Cu
# 用于训练有标记与无标记样本集合
train_sample = np.vstack((labeled[:, :2], unlabeled[:, :2]))
# 用于训练的标记集合
train_label = np.hstack((labeled[:, -1], fake_label))
unlabeled_id = np.arange(len(unlabeled))

while Cu < Cl:
    clf.fit(train_sample, train_label, sample_weight=weight)
    while True:
        # 通过训练得到的预测标记
        predicted_y = clf.decision_function(unlabeled[:, :2])
        # 伪标记,这里为与预测的区分开,写为real_y
        real_y = fake_label
        epsilon = 1 - predicted_y * real_y
        positive_set, positive_id = epsilon[real_y > 0], unlabeled_id[real_y > 0]
        negative_set, negative_id = epsilon[real_y < 0], unlabeled_id[real_y < 0]
        positive_max_id = positive_id[np.argmax(positive_set)]
        negative_max_id = negative_id[np.argmax(negative_set)]
        epsilon1, epsilon2 = epsilon[positive_max_id], epsilon[negative_max_id]
        if epsilon1 > 0 and epsilon2 > 0 and round(epsilon1 + epsilon2, 3) >= 2:
            fake_label[positive_max_id] = -fake_label[positive_max_id]
            fake_label[negative_max_id] = -fake_label[negative_max_id]
            train_label = np.hstack((labeled[:, -1], fake_label))
            clf.fit(train_sample, train_label, sample_weight=weight)
        else:
            break
    # 更新Cu
    Cu = min(2 * Cu, Cl)
    # 更新样本权重
    weight[len(unlabeled):] = Cu
# 绘图
x_points = np.linspace(0, 1, 10)
y_points = -(clf.coef_[0][0] * x_points + clf.intercept_) / clf.coef_[0][1]
plt.plot(x_points, y_points, color='yellow')
plt.savefig('运行结果.jpg')
plt.show()
# 打印结果
print('经过TSVM训练后,对未标记样本的预测正确率为{}'.format(clf.score(unlabeled[:, :2], unlabeled[:, -1])))
print('经过TSVM训练后,对测试样本的预测正确率为{}'.format(clf.score(test[:, :2], test[:, -1])))
运行程序后,我们得到:经过有标记的样本训练后,对未标记样本的预测正确率为0.9666666666666667,经过TSVM训练后,对未标记样本的预测正确率为0.9833333333333333,经过TSVM训练后,对测试样本的预测正确率为1.0。
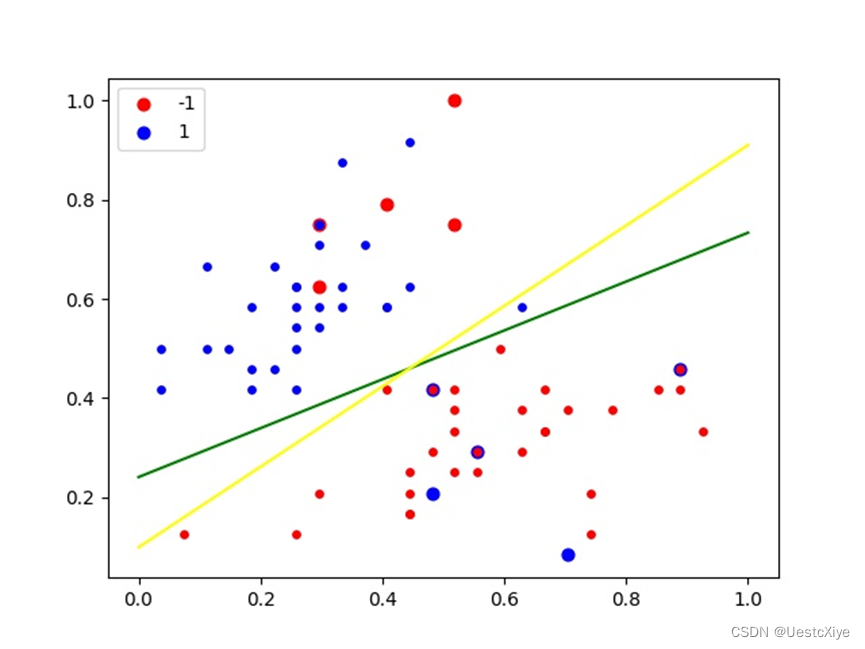
图1 散点图与超平面
程序绘制的散点图和超平面如图1所示。其中,绿线是仅利用有标记样本的SVM得到的超平面,黄线是利用无标记样本的TSVM模型得到的超平面。
由实验结果可知,对于iris数据集,TSVM通过利用未标记数据能提高最终分类的准确率,从SVM的96.67%提高到了TSVM的98.33%,并且预测标记与测试集的真实标记一致,预测正确率为100%。
题目2
假设数据由混合专家(mixture of experts)模型生成,即数据是基于k个成分混合而得的概率密度生成: p ( x │ θ ) = ∑ ( i = 1 ) k [ α i ⋅ p ( x │ θ i ) ] p(x│θ)=∑_(i=1)^k[α_i·p(x│θ_i ) ] p(x│θ)=∑(i=1)k[αi⋅p(x│θi)],其中, θ = θ 1 , θ 2 , … , θ k θ={θ_1,θ_2,…,θ_k} θ=θ1,θ2,…,θk是模型参数, p ( x │ θ i ) p(x│θ_i ) p(x│θi)是第 i i i个混合成分的概率密度,混合系数 α i ≥ 0 , ∑ ( i = 1 ) k [ α i = 1 ] α_i≥0,∑_(i=1)^k[α_i=1] αi≥0,∑(i=1)k[αi=1]。假设每个混合成分对应一个类别,但每个类别可能包含多个混合成分。试推导相应的生成式半监督学习算法。


 575
575

 被折叠的 条评论
为什么被折叠?
被折叠的 条评论
为什么被折叠?
 到【灌水乐园】发言


