


 本文介绍了Numpy中的几个关键函数,包括np.min和np.amin,它们在计算最小值时略有区别,np.amin提供了保持维度的选项。接着讨论了np.percentile,特别是其interpolation参数对小数组处理的影响,并补充了插值法的图示说明。最后提到了np.cov,用于计算协方差,同时也可用于计算方差。
np.min & np.amin
manual: https://numpy.org/doc/stable/reference/generated/numpy.amin.html
keypoints:
- 两者功能基本一致,np.min 更易用一点
- keepdims = True 保持矩阵原格式输出
import numpy as np
test_array = np.array([[1,2,3],[4,5,6],[7,8,9]])

# array.min()可用但array.amin()不可用
test_array.min(1)  #axis = 1
#out: array([1, 4, 7])

test_array.amin(1)
#out: AttributeError: 'numpy.ndarray' object has no attribute 'amin'

# np.min & np.amin 用法一致
np.amin(test_array,axis=1)
#out: array([1, 4, 7])

np.min(test_array,axis=1)
#out: array([1, 4, 7])

#keepdims 保持矩阵格式输出
np.amin(test_array2,axis=1,keepdims=True)
#out: array([[1],
#out:        [4],
#out:        [7]])
np.percentile
manual: https://numpy.org/doc/stable/reference/generated/numpy.percentile.html?highlight=percentile#numpy.percentile
keypoints:
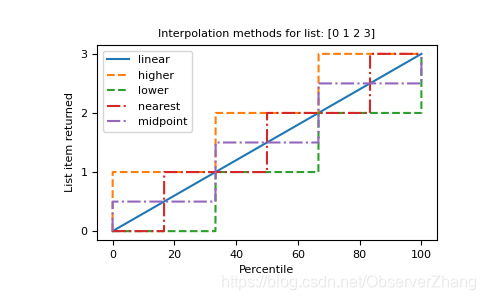
interpolation 默认为 ‘linear’,使用插值法计算分位数因此在处理小数组时结果很可能不是数组中的值。
	a = np.array([[10, 7, 4], [3, 2, 1]])
	np.percentile(a,[25,50],axis = 1)
	#out: array([[5.5, 1.5],
    #out         [7. , 2. ]])
补充关于interpolation各选项的完美图示
import matplotlib.pyplot as plt

a = np.arange(4)
p = np.linspace(0, 100, 6001)
ax = plt.gca()
lines = [
    ('linear', None),
    ('higher', '--'),
    ('lower', '--'),
    ('nearest', '-.'),
    ('midpoint', '-.'),
]
for interpolation, style in lines:
    ax.plot(
        p, np.percentile(a, p, interpolation=interpolation),
        label=interpolation, linestyle=style)
ax.set(
    title='Interpolation methods for list: ' + str(a),
    xlabel='Percentile',
    ylabel='List item returned',
    yticks=a)
ax.legend()
plt.show()
np.cov
manual: https://numpy.org/doc/stable/reference/generated/numpy.cov.html?highlight=cov#numpy.cov
协方差的计算公式

x关于自身的协方差,同时是方差计算公式

未完待续(这块基础不是很好,复习完继续补充…


 538
538

 被折叠的 条评论
为什么被折叠?
被折叠的 条评论
为什么被折叠?
 到【灌水乐园】发言


