


 本文介绍如何在Vue项目中利用ECharts组件绘制地图,通过具体的代码示例和注释,展示了实现过程。
在vue中使用echarts绘制图表
npm install echarts --save // 全局安装echarts具体代码及注释如下 :
<template>
<div>
<!-- 为ECharts准备一个具备大小(宽高)的Dom -->
<div id="map" :style="{width: '700px', height: '500px'}"></div>
</div>
</template>
<script>
import echarts from 'echarts'
// 引入中国地图数据
import china from 'echarts/map/json/china.json'
// 注册地图
echarts.registerMap('china', china)
export default {
data() {
return {}
},
mounted() {
this.map()
},
methods: {
map() {
// 基于准备好的dom,初始化echarts实例
let map = this.$el.querySelector('#map')
function resizeMyChart() {
map.style.width = (document.body.offsetWidth / 2) + 'px'//页面一半的大小
}
resizeMyChart();
// 绘制地图
let myChartChina = echarts.init(map)
myChartChina.setOption({
tooltip: {
trigger: 'item',
formatter: "{a} <br/>{b} : {c}%"
},
legend: {
orient: 'vertical',
left: 'center',
data: ['地域分布']
},
visualMap: {
min: 0,
max: 100,
formatter: '{value}%', // 按百分比格式显示
left: '5%',
top: 'bottom',
text: ['高', '低'],
calculable: true,
color: ['#0b50b9', '#c3e2f4']
},
selectedMode: 'single',
series: [
{
name: '地域分布',
type: 'map',
mapType: 'china',
itemStyle: {
normal: {
borderColor: 'rgba(0, 0, 0, 0.2)'
},
emphasis: {
shadowOffsetX: 0,
shadowOffsetY: 0,
shadowBlur: 20,
borderWidth: 0,
shadowColor: 'rgba(0, 0, 0, 0.5)'
}
},
showLegendSymbol: true,
label: {
normal: {
show: true
},
emphasis: {
show: true
}
},
// 具体城市对应的数据
data: [
{ value: 50, name: '北京' },
{ value: 20, name: '上海' },
{ value: 23, name: '陕西' },
{ value: 12, name: '青海' },
{ value: 10, name: '内蒙古' }
// ...
]
}
]
})
// 页面缩放时调整地图大小
window.onresize = function() {
myChartChina.resize();
}
}
}
}
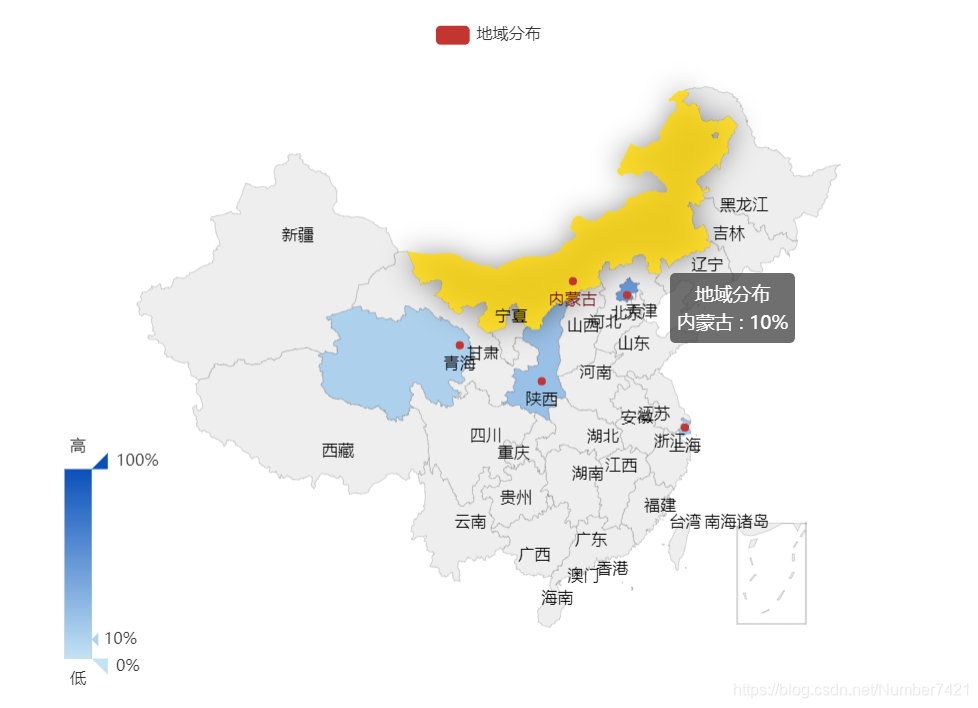
</script>绘制出的结果:


 1396
1396

 被折叠的 条评论
为什么被折叠?
被折叠的 条评论
为什么被折叠?
 到【灌水乐园】发言


