


import numpy as np
import matplotlib.pyplot as plt
# 参数设置
n_points = 10000 # 总点数
radius = 1 # 圆半径
# 生成随机点
x = np.random.uniform(-radius, radius, n_points)
y = np.random.uniform(-radius, radius, n_points)
# 判断点是否在圆内
inside = (x**2 + y**2) <= radius**2
# 绘制结果
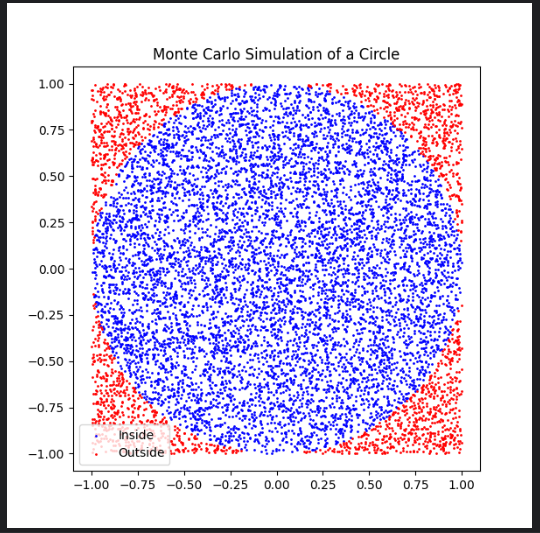
plt.figure(figsize=(6,6))
plt.scatter(x[inside], y[inside], color='blue', s=1, label='Inside')
plt.scatter(x[~inside], y[~inside], color='red', s=1, label='Outside')
plt.axis('equal')
plt.legend()
plt.title('Monte Carlo Simulation of a Circle')
plt.show()
# 计算π的近似值
pi_estimate = 4 * np.sum(inside) / n_points
print(f"Estimated value of π: {pi_estimate}")
绘制任意函数图形
import numpy as np
import matplotlib.pyplot as plt
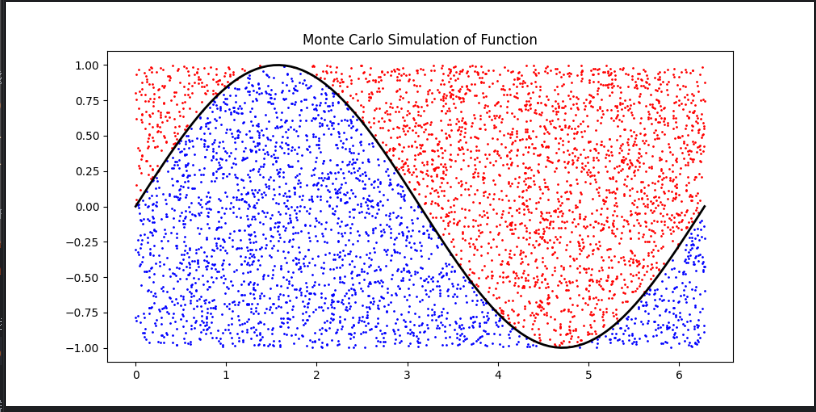
def f(x):
return np.sin(x) # 可以替换为任何函数
# 参数设置
n_points = 5000
x_min, x_max = 0, 2*np.pi
y_min, y_max = -1, 1
# 生成随机点
x_rand = np.random.uniform(x_min, x_max, n_points)
y_rand = np.random.uniform(y_min, y_max, n_points)
# 判断点是否在函数曲线下方
below = y_rand <= f(x_rand)
# 绘制结果
plt.figure(figsize=(10,5))
x_vals = np.linspace(x_min, x_max, 100)
plt.plot(x_vals, f(x_vals), 'k-', linewidth=2)
plt.scatter(x_rand[below], y_rand[below], color='blue', s=1)
plt.scatter(x_rand[~below], y_rand[~below], color='red', s=1)
plt.title('Monte Carlo Simulation of Function')
plt.show()
# 计算曲线下面积
area = (x_max-x_min)*(y_max-y_min)*np.sum(below)/n_points
print(f"Estimated area under curve: {area}")
绘制复杂图形(心形)
import numpy as np
import matplotlib.pyplot as plt
# 心形线参数方程
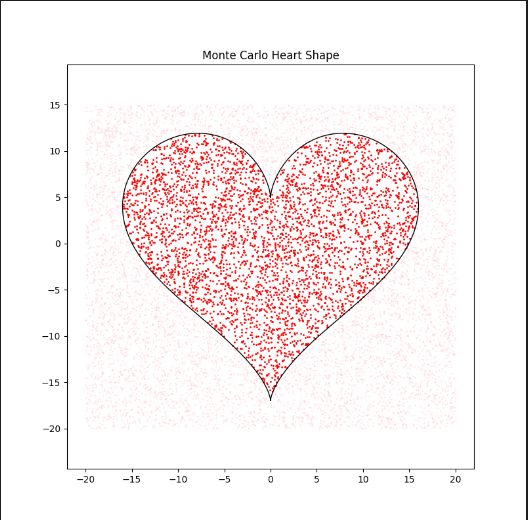
def heart(t):
x = 16*np.sin(t)**3
y = 13*np.cos(t)-5*np.cos(2*t)-2*np.cos(3*t)-np.cos(4*t)
return x, y
# 参数设置
n_points = 10000
x_min, x_max = -20, 20
y_min, y_max = -20, 15
# 生成随机点
x_rand = np.random.uniform(x_min, x_max, n_points)
y_rand = np.random.uniform(y_min, y_max, n_points)
# 判断点是否在心形线内
t = np.linspace(0, 2*np.pi, 1000)
hx, hy = heart(t)
inside = np.zeros(n_points, dtype=bool)
for i in range(n_points):
# 使用射线法判断点是否在多边形内
crossings = 0
for j in range(len(t)-1):
if ((hx[j] > x_rand[i]) != (hx[j+1] > x_rand[i])):
intersect = (y_rand[i] < (hy[j+1]-hy[j])/(hx[j+1]-hx[j])*(x_rand[i]-hx[j]) + hy[j])
if intersect:
crossings += 1
inside[i] = crossings % 2 == 1
# 绘制结果
plt.figure(figsize=(8,8))
plt.scatter(x_rand[inside], y_rand[inside], color='red', s=1)
plt.scatter(x_rand[~inside], y_rand[~inside], color='pink', s=1, alpha=0.3)
plt.plot(hx, hy, 'k-', linewidth=1)
plt.axis('equal')
plt.title('Monte Carlo Heart Shape')
plt.show()


 482
482

 被折叠的 条评论
为什么被折叠?
被折叠的 条评论
为什么被折叠?
 到【灌水乐园】发言


