


前言
本次gitCode首发了文心4.5的一系列版本,其中21B的模型相对来说处在我们一般程序员可以自行跑的一个范围,相对十几B的千帆来说肯定是更好一些,我专门搞数学的,那么咱们本次就搞一下数学图形能力的对比,对比的模型是DeepSeek。
一起来轻松玩转文心大模型吧👉一文心大模型免费下载地址: https://ai.gitcode.com/theme/1939325484087291906

目录
基础环境
文心21B环境
这里我们需要控制一下部署环境的算力。
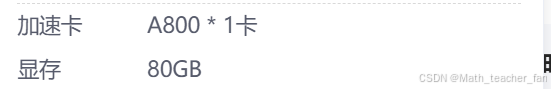
有了A800显卡,并且显存达到了80G,我们就能正常的玩耍21B模型了。
模型21B-A3B-Base-Paddle下载
使用FastDeploy的方式来下载,对于单卡部署,至少需要 80G 的 GPU 内存资源。
python -m fastdeploy.entrypoints.openai.api_server \
       --model baidu/ERNIE-4.5-21B-A3B-Base-Paddle \
       --port 8180 \
       --metrics-port 8181 \
       --engine-worker-queue-port 8182 \
       --max-model-len 32768
       --max-num-seqs 32
我们根据这个脚本语言来直接安装即可,但是需要提前将环境处理一下。
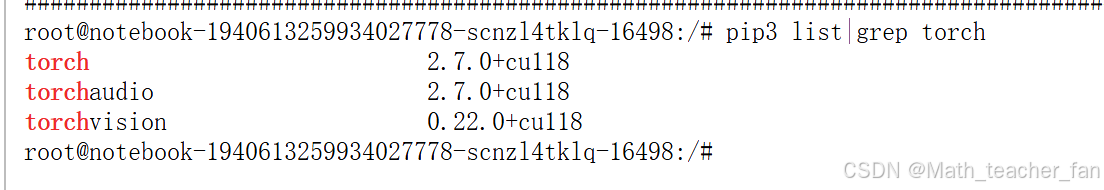
看一下自己的torch,我这是刚好的版本。
给出了对应环境的下载命令:

命令集:
python -m pip install paddlepaddle-gpu==3.1.0 -i https://www.paddlepaddle.org.cn/packages/stable/cu126/

python -m pip install fastdeploy-gpu -i https://www.paddlepaddle.org.cn/packages/stable/fastdeploy-gpu-80_90/ --extra-index-url https://mirrors.tuna.tsinghua.edu.cn/pypi/web/simple
提前下载好直接启动即可。
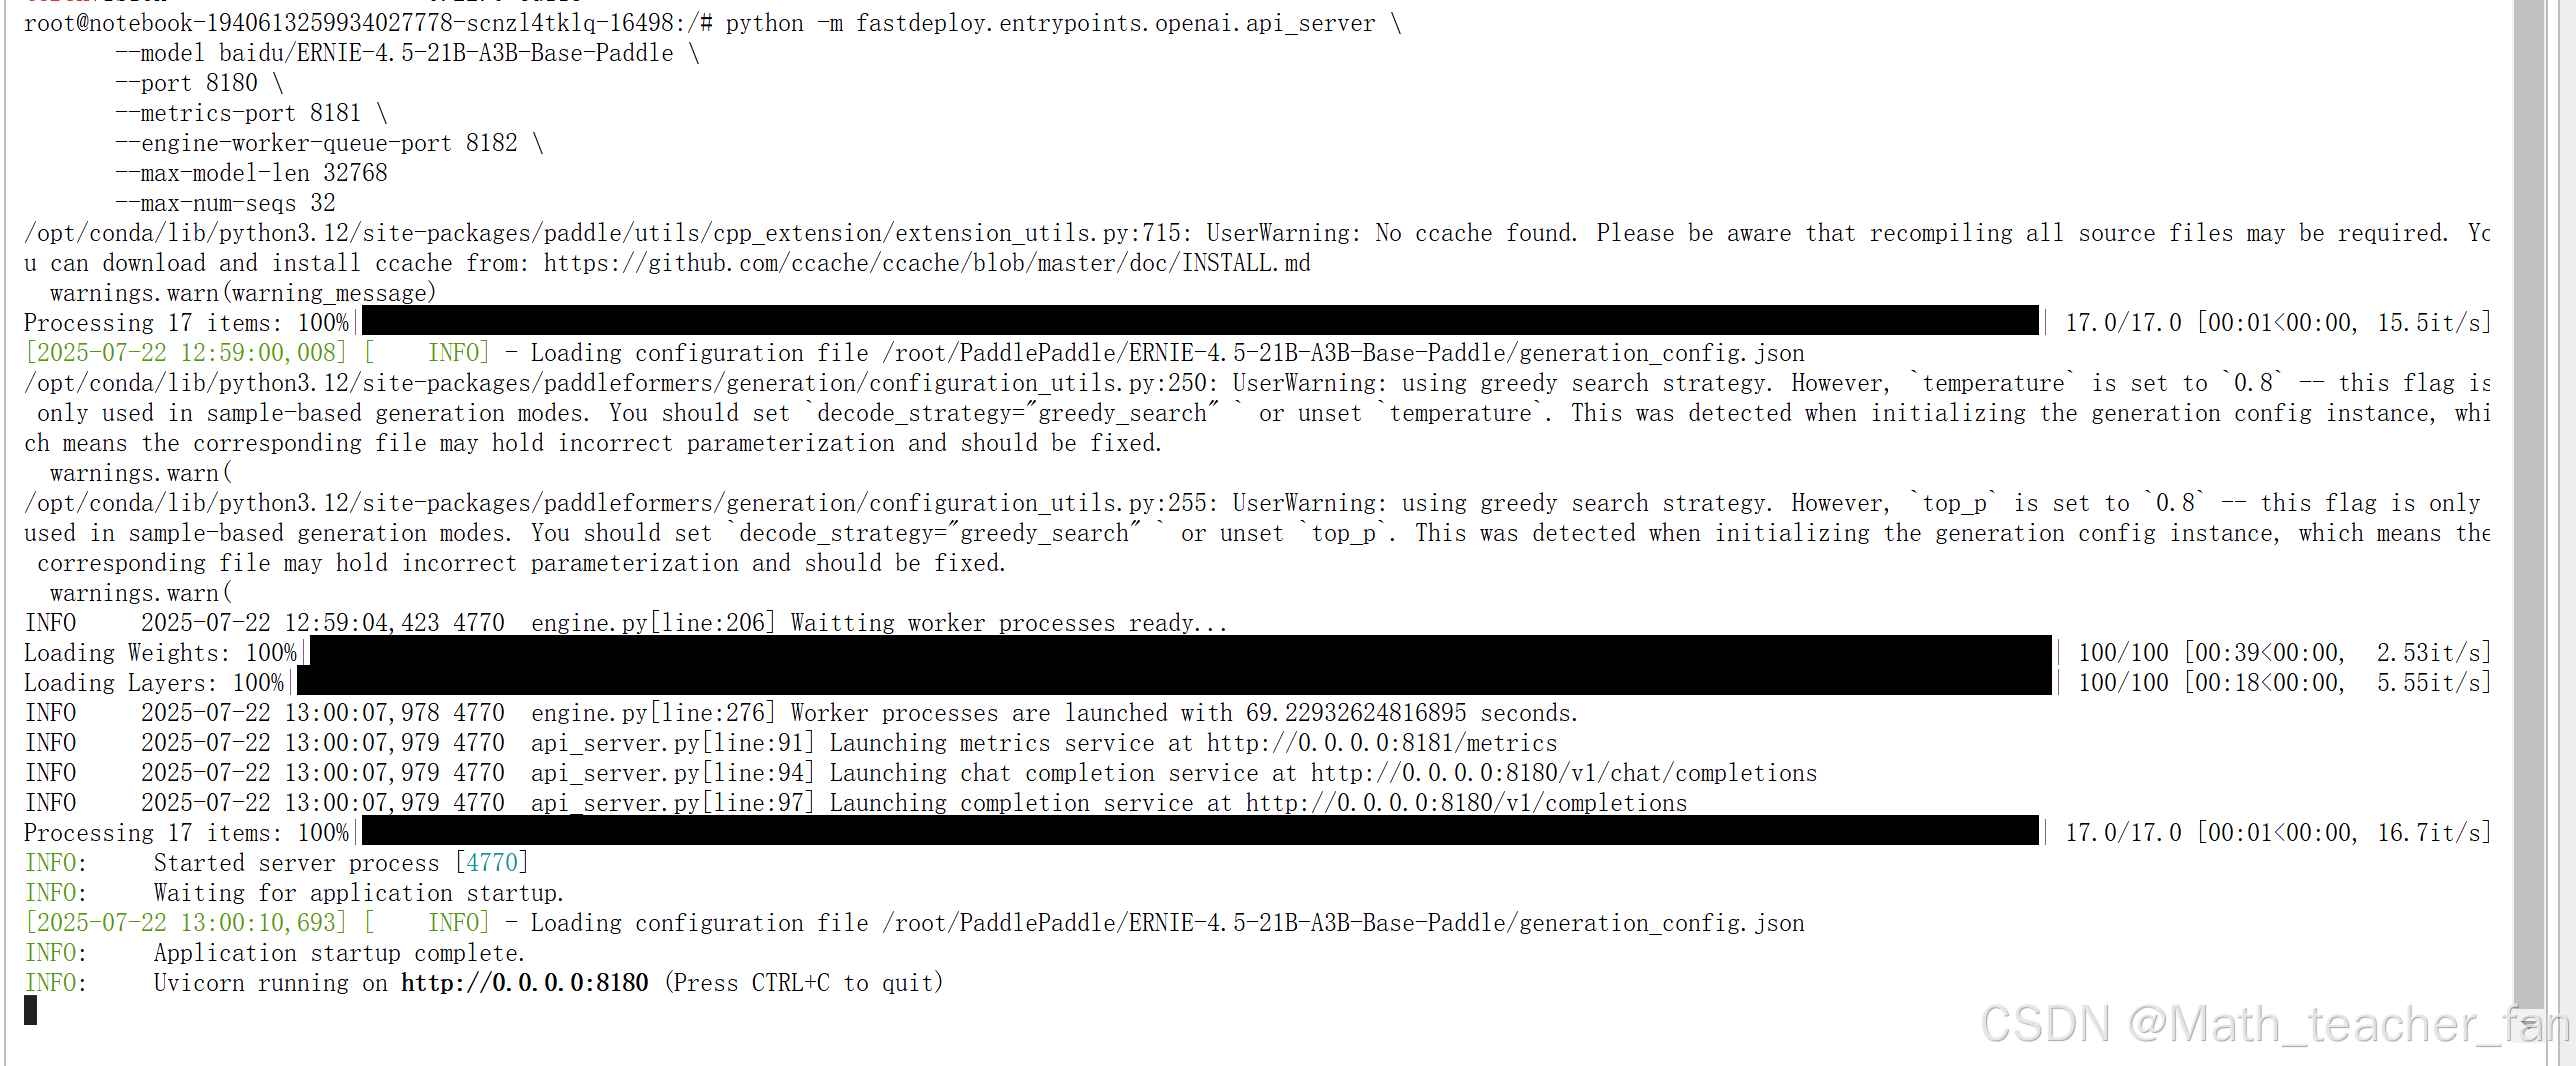
我们可以看到,当前已经启动完毕了。
DeepSeek-R1
测试的网址:DeepSeek
 可以看到我准备好了的问题。
环境代码
这里我们需要使用requests的方式来请求,返回的信息我这里json处理了一下。
import requests
import json

def send_request():
    url = "http://127.0.0.1:8180/v1/chat/completions"
    headers = {"Content-Type": "application/json"}
    data = {
        "model": "baidu/ERNIE-4.5-21B-A3B-Base-Paddle",
        "messages": [
            {"role": "system", "content": "你是一位数学大师。"},
            {"role": "user", "content": "使用html5绘制一下单调递增函数与单调递减函数在平面直角坐标系上的区别,给出具体函数,函数的参数是可以通过input来控制。"}
        ]
    }

    try:
        response = requests.post(url, headers=headers, data=json.dumps(data))
        result = response.json()
        print(result["choices"][0]["message"]["content"])
    except Exception as e:
        print(f"错误: {e}")

if __name__ == "__main__":
    send_request()
对比题目
使用html5绘制一下单调递增函数与单调递减函数在平面直角坐标系上的区别,给出具体函数,函数的参数是可以通过input来控制。
DeepSeek回答情况
代码部分:
<!DOCTYPE html>
<html lang="zh-CN">
<head>
    <meta charset="UTF-8">
    <meta name="viewport" content="width=device-width, initial-scale=1.0">
    <title>单调函数比较</title>
    <style>
        body {
            font-family: Arial, sans-serif;
            margin: 20px;
        }
        .container {
            display: flex;
            flex-direction: column;
            align-items: center;
        }
        canvas {
            border: 1px solid #ccc;
            margin-top: 20px;
        }
        .controls {
            margin-top: 20px;
            display: flex;
            gap: 20px;
            align-items: center;
        }
        .control-group {
            display: flex;
            flex-direction: column;
            gap: 5px;
        }
        label {
            font-weight: bold;
        }
        input[type="number"] {
            width: 100px;
            padding: 5px;
        }
    </style>
</head>
<body>
    <div class="container">
        <h1>单调函数比较</h1>
        <div class="controls">
            <div class="control-group">
                <label for="xMin">X最小值:</label>
                <input type="number" id="xMin" value="-10" step="0.1">
            </div>
            <div class="control-group">
                <label for="xMax">X最大值:</label>
                <input type="number" id="xMax" value="10" step="0.1">
            </div>
            <div class="control-group">
                <label for="yMin">Y最小值:</label>
                <input type="number" id="yMin" value="-10" step="0.1">
            </div>
            <div class="control-group">
                <label for="yMax">Y最大值:</label>
                <input type="number" id="yMax" value="10" step="0.1">
            </div>
        </div>
        <canvas id="graphCanvas" width="600" height="400"></canvas>
    </div>

    <script>
        const canvas = document.getElementById('graphCanvas');
        const ctx = canvas.getContext('2d');

        // 初始参数
        let params = {
            xMin: -10,
            xMax: 10,
            yMin: -10,
            yMax: 10,
            a: 1,  // 线性函数斜率
            b: 0,  // 线性函数截距
            c: 0,  // 指数函数底数
            d: 1   // 指数函数指数
        };

        // 绘制函数
        function drawFunctions() {
            // 清除画布
            ctx.clearRect(0, 0, canvas.width, canvas.height);

            // 绘制坐标轴
            drawAxes();

            // 绘制单调递增函数 (线性函数 y = ax + b)
            drawMonotonicFunction('递增', 'linear', params.a, params.b);

            // 绘制单调递减函数 (指数函数 y = c * d^x)
            drawMonotonicFunction('递减', 'exponential', params.c, params.d);

            // 绘制函数标签
            drawFunctionLabels();
        }

        // 绘制坐标轴
        function drawAxes() {
            // X轴
            ctx.beginPath();
            ctx.moveTo(50, 350);
            ctx.lineTo(550, 350);
            ctx.strokeStyle = '#333';
            ctx.lineWidth = 1;
            ctx.stroke();

            // Y轴
            ctx.beginPath();
            ctx.moveTo(50, 350);
            ctx.lineTo(50, 50);
            ctx.stroke();

            // 刻度
            ctx.font = '12px Arial';
            ctx.fillStyle = '#333';

            // X轴刻度
            for (let x = params.xMin; x <= params.xMax; x += 1) {
                const xPos = 50 + x * (500 / (params.xMax - params.xMin));
                ctx.fillText(x.toFixed(1), xPos - 5, 365);
                ctx.beginPath();
                ctx.moveTo(xPos, 350);
                ctx.lineTo(xPos, 360);
                ctx.stroke();
            }

            // Y轴刻度
            for (let y = params.yMin; y <= params.yMax; y += 1) {
                const yPos = 50 - y * (300 / (params.yMax - params.yMin));
                ctx.fillText(y.toFixed(1), 45, yPos + 5);
                ctx.beginPath();
                ctx.moveTo(50, yPos);
                ctx.lineTo(60, yPos);
                ctx.stroke();
            }

            // 坐标轴标签
            ctx.fillText('X', 5, 360);
            ctx.fillText('Y', 45, 35);
        }

        // 绘制单调函数
        function drawMonotonicFunction(name, type, a, b) {
            ctx.strokeStyle = type === 'linear' ? '#0066cc' : '#cc0000';
            ctx.lineWidth = 2;

            // 绘制函数
            ctx.beginPath();

            if (type === 'linear') {
                // 线性函数: y = ax + b
                for (let x = params.xMin; x <= params.xMax; x += 0.1) {
                    const y = a * x + b;
                    if (x === params.xMin) {
                        ctx.moveTo(50 + x * (500 / (params.xMax - params.xMin)), 350 - y * (300 / (params.yMax - params.yMin)));
                    } else {
                        ctx.lineTo(50 + x * (500 / (params.xMax - params.xMin)), 350 - y * (300 / (params.yMax - params.yMin)));
                    }
                }
            } else if (type === 'exponential') {
                // 指数函数: y = c * d^x
                for (let x = params.xMin; x <= params.xMax; x += 0.1) {
                    const y = params.c * Math.pow(params.d, x);
                    if (x === params.xMin) {
                        ctx.moveTo(50 + x * (500 / (params.xMax - params.xMin)), 350 - y * (300 / (params.yMax - params.yMin)));
                    } else {
                        ctx.lineTo(50 + x * (500 / (params.xMax - params.xMin)), 350 - y * (300 / (params.yMax - params.yMin)));
                    }
                }
            }

            ctx.stroke();

            // 绘制函数名称
            ctx.fillStyle = type === 'linear' ? '#0066cc' : '#cc0000';
            ctx.font = '14px Arial';
            ctx.fillText(name + '函数', 50 + (params.xMax - params.xMin) * 0.05, 370);
        }

        // 绘制函数标签
        function drawFunctionLabels() {
            ctx.fillStyle = '#333';
            ctx.font = '12px Arial';

            // 线性函数标签
            ctx.fillText('y = ax + b', 50 + (params.xMax - params.xMin) * 0.1, 330);

            // 指数函数标签
            ctx.fillText('y = c * d^x', 50 + (params.xMax - params.xMin) * 0.1, 310);
        }

        // 监听输入变化
        document.getElementById('xMin').addEventListener('input', updateParams);
        document.getElementById('xMax').addEventListener('input', updateParams);
        document.getElementById('yMin').addEventListener('input', updateParams);
        document.getElementById('yMax').addEventListener('input', updateParams);

        // 更新参数并重绘
        function updateParams() {
            params.xMin = parseFloat(document.getElementById('xMin').value);
            params.xMax = parseFloat(document.getElementById('xMax').value);
            params.yMin = parseFloat(document.getElementById('yMin').value);
            params.yMax = parseFloat(document.getElementById('yMax').value);

            // 确保坐标轴范围合理
            if (params.xMax <= params.xMin) params.xMax = params.xMin + 1;
            if (params.yMax <= params.yMin) params.yMax = params.yMin + 1;

            drawFunctions();
        }

        // 初始绘制
        drawFunctions();
    </script>
</body>
</html>
功能部分:
-
可控制参数:
- X轴范围 (-10到10)
- Y轴范围 (-10到10)
- 线性函数参数: 斜率(a)和截距(b)
- 指数函数参数: 底数©和指数(d) -
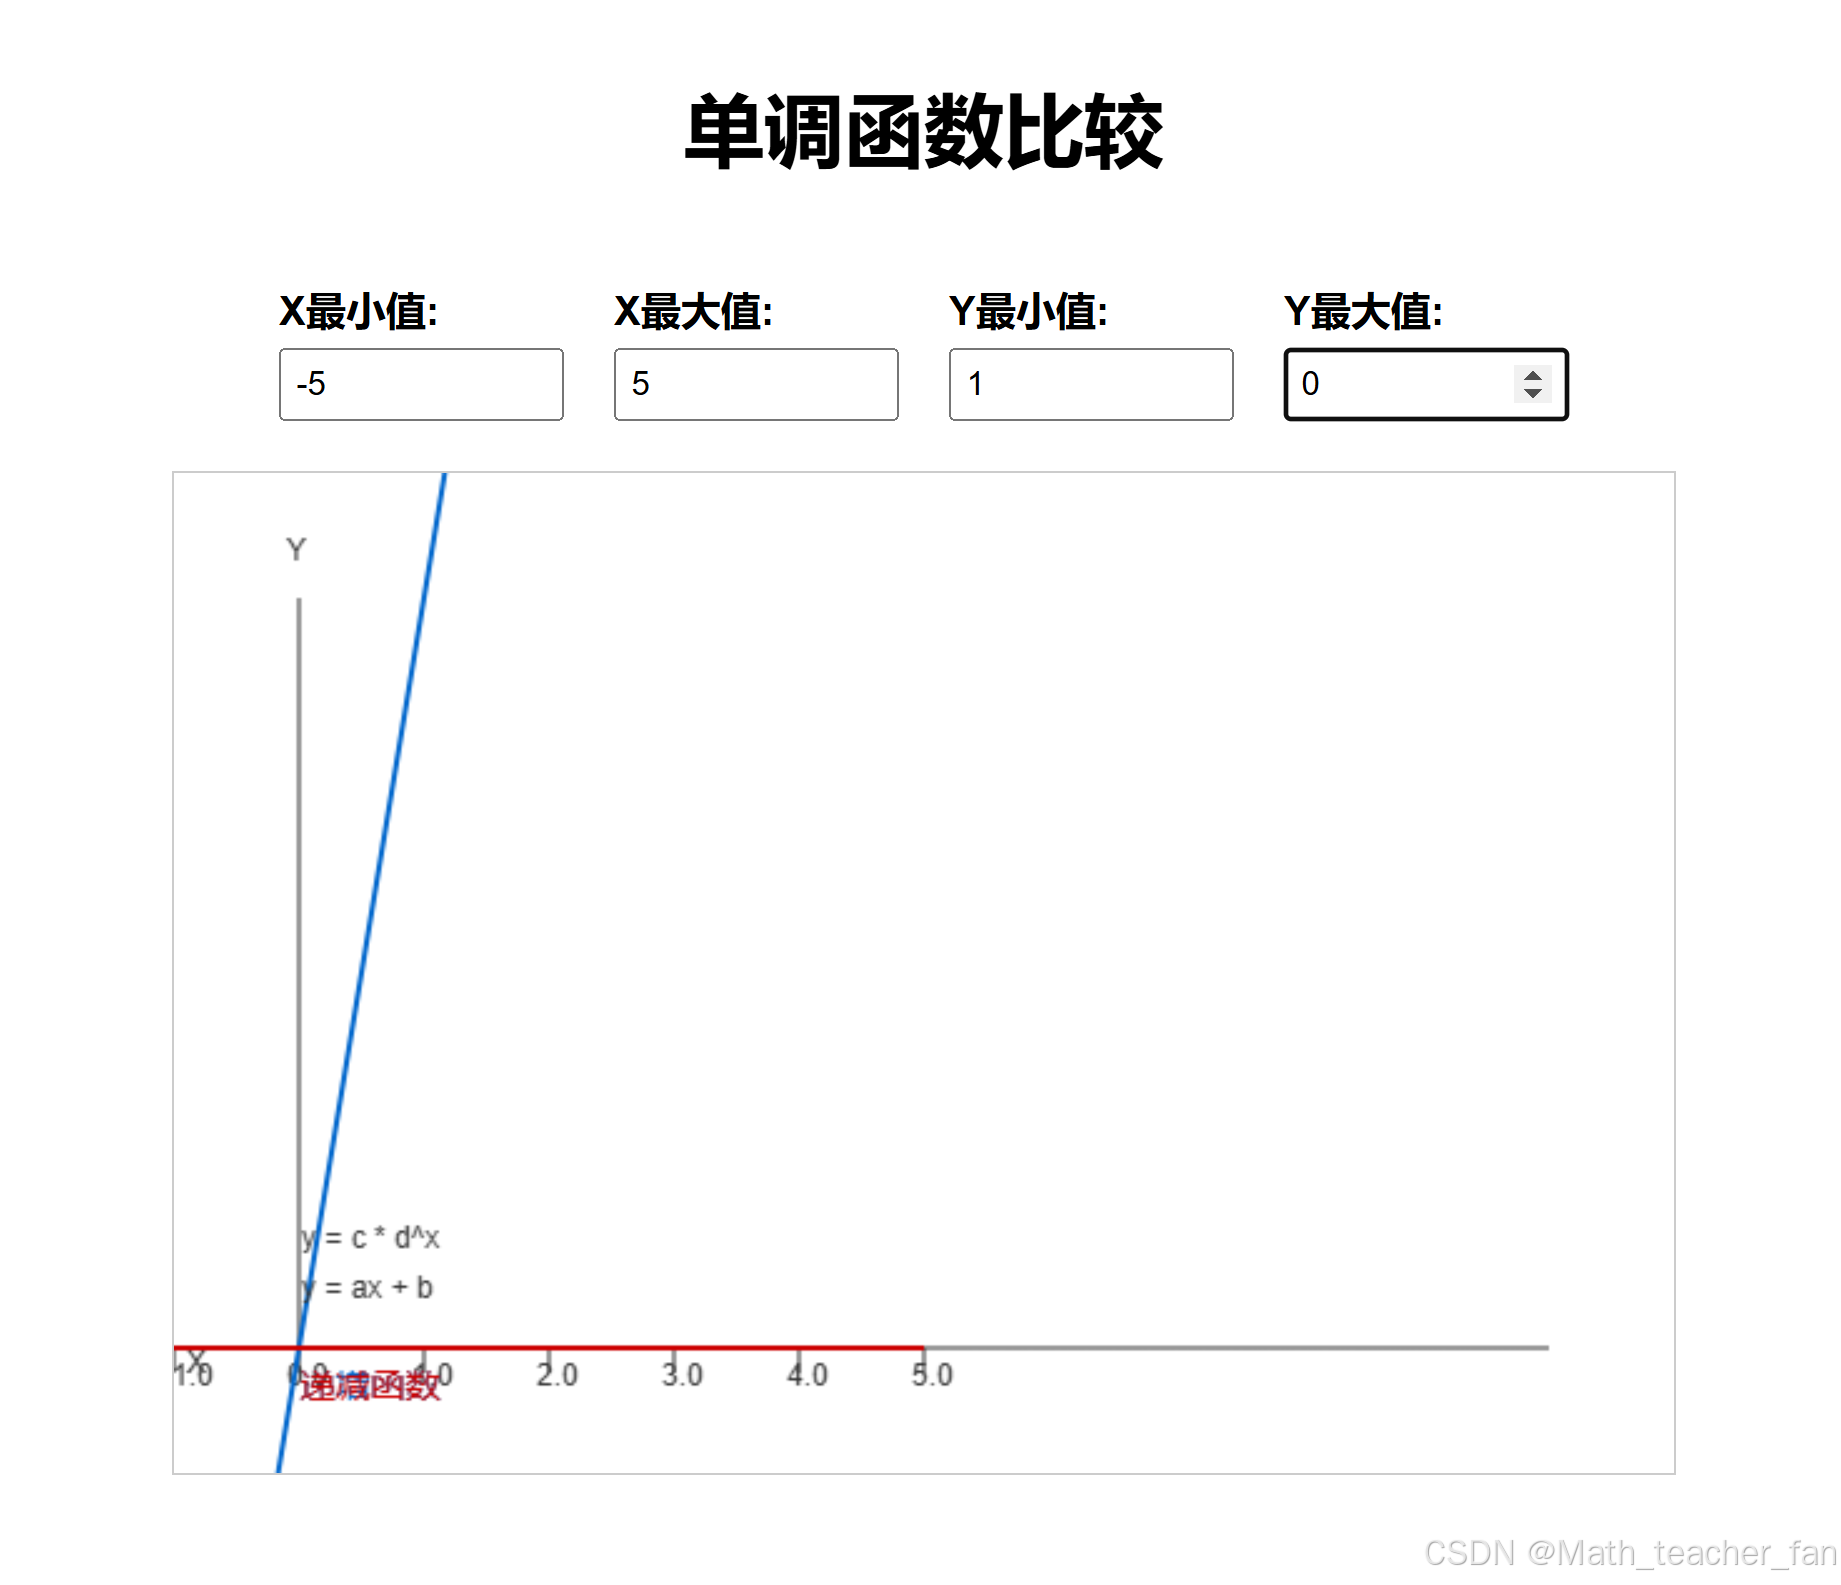
绘制内容:
- 红色曲线: 单调递减的指数函数 y = c * d^x
- 蓝色曲线: 单调递增的线性函数 y = ax + b
- 坐标轴和刻度
- 函数名称标签 -
交互功能:
- 通过输入框可以调整函数参数
- 实时更新函数图像
-
单调递增函数:
- 线性函数 y = ax + b (a > 0)
- 指数函数 y = c * d^x (d > 1)
- 当x增加时,y值也增加 -
单调递减函数:
- 线性函数 y = ax + b (a < 0)
- 指数函数 y = c * d^x (0 < d < 1)
- 当x增加时,y值减小
效果部分:
文心21B回答
代码部分:
<!DOCTYPE html>
<html lang="zh-CN">
<head>
    <meta charset="UTF-8">
    <meta name="viewport" content="width=device-width, initial-scale=1.0">
    <title>单调函数比较</title>
    <style>
        body {
            font-family: Arial, sans-serif;
            max-width: 800px;
            margin: 0 auto;
            padding: 20px;
        }
        .container {
            display: flex;
            flex-direction: column;
            gap: 20px;
        }
        .controls {
            display: flex;
            flex-wrap: wrap;
            gap: 15px;
            padding: 15px;
            background-color: #f5f5f5;
            border-radius: 5px;
        }
        .control-group {
            display: flex;
            flex-direction: column;
            gap: 5px;
        }
        canvas {
            border: 1px solid #ccc;
            background-color: white;
        }
        label {
            font-weight: bold;
        }
        input {
            padding: 5px;
            width: 80px;
        }
        button {
            padding: 8px 15px;
            background-color: #4CAF50;
            color: white;
            border: none;
            border-radius: 4px;
            cursor: pointer;
        }
        button:hover {
            background-color: #45a049;
        }
    </style>
</head>
<body>
    <h1>单调递增与单调递减函数比较</h1>
    <div class="container">
        <div class="controls">
            <div class="control-group">
                <label for="a1">递增函数斜率 (a):</label>
                <input type="number" id="a1" value="1" step="0.1">
            </div>
            <div class="control-group">
                <label for="b1">递增函数截距 (b):</label>
                <input type="number" id="b1" value="0" step="0.1">
            </div>
            <div class="control-group">
                <label for="a2">递减函数斜率 (a):</label>
                <input type="number" id="a2" value="-1" step="0.1">
            </div>
            <div class="control-group">
                <label for="b2">递减函数截距 (b):</label>
                <input type="number" id="b2" value="5" step="0.1">
            </div>
            <div class="control-group">
                <label for="xMin">X最小值:</label>
                <input type="number" id="xMin" value="-5" step="0.1">
            </div>
            <div class="control-group">
                <label for="xMax">X最大值:</label>
                <input type="number" id="xMax" value="5" step="0.1">
            </div>
            <button onclick="drawGraph()">更新图形</button>
        </div>
        <canvas id="functionCanvas" width="700" height="500"></canvas>
    </div>

    <script>
        const canvas = document.getElementById('functionCanvas');
        const ctx = canvas.getContext('2d');

        // 初始绘制
        window.onload = drawGraph;

        function drawGraph() {
            // 获取输入值
            const a1 = parseFloat(document.getElementById('a1').value);
            const b1 = parseFloat(document.getElementById('b1').value);
            const a2 = parseFloat(document.getElementById('a2').value);
            const b2 = parseFloat(document.getElementById('b2').value);
            const xMin = parseFloat(document.getElementById('xMin').value);
            const xMax = parseFloat(document.getElementById('xMax').value);

            // 清除画布
            ctx.clearRect(0, 0, canvas.width, canvas.height);

            // 设置坐标系参数
            const padding = 50;
            const graphWidth = canvas.width - 2 * padding;
            const graphHeight = canvas.height - 2 * padding;

            // 计算缩放比例
            const xScale = graphWidth / (xMax - xMin);
            const yValues = [];

            // 计算y值范围
            for (let x = xMin; x <= xMax; x += 0.1) {
                yValues.push(a1 * x + b1);
                yValues.push(a2 * x + b2);
            }

            const yMin = Math.min(...yValues);
            const yMax = Math.max(...yValues);
            const yScale = graphHeight / (yMax - yMin);

            // 绘制坐标轴
            ctx.strokeStyle = '#000';
            ctx.lineWidth = 2;

            // X轴
            const xAxisY = padding + (0 - yMin) * yScale;
            ctx.beginPath();
            ctx.moveTo(padding, xAxisY);
            ctx.lineTo(padding + graphWidth, xAxisY);
            ctx.stroke();

            // Y轴
            const yAxisX = padding + (0 - xMin) * xScale;
            ctx.beginPath();
            ctx.moveTo(yAxisX, padding);
            ctx.lineTo(yAxisX, padding + graphHeight);
            ctx.stroke();

            // 绘制刻度
            ctx.font = '12px Arial';
            ctx.fillStyle = '#000';
            ctx.textAlign = 'center';

            // X轴刻度
            const xStep = Math.ceil((xMax - xMin) / 10);
            for (let x = Math.ceil(xMin / xStep) * xStep; x <= xMax; x += xStep) {
                const xPos = padding + (x - xMin) * xScale;
                ctx.beginPath();
                ctx.moveTo(xPos, xAxisY - 5);
                ctx.lineTo(xPos, xAxisY + 5);
                ctx.stroke();
                ctx.fillText(x.toFixed(1), xPos, xAxisY + 20);
            }

            // Y轴刻度
            const yStep = Math.ceil((yMax - yMin) / 10);
            for (let y = Math.ceil(yMin / yStep) * yStep; y <= yMax; y += yStep) {
                const yPos = padding + (yMax - y) * yScale;
                ctx.beginPath();
                ctx.moveTo(yAxisX - 5, yPos);
                ctx.lineTo(yAxisX + 5, yPos);
                ctx.stroke();
                ctx.fillText(y.toFixed(1), yAxisX - 20, yPos + 5);
            }

            // 绘制函数
            ctx.lineWidth = 2;

            // 递增函数 (a1*x + b1)
            ctx.strokeStyle = 'blue';
            ctx.beginPath();
            for (let x = xMin; x <= xMax; x += 0.1) {
                const y = a1 * x + b1;
                const xPos = padding + (x - xMin) * xScale;
                const yPos = padding + (yMax - y) * yScale;

                if (x === xMin) {
                    ctx.moveTo(xPos, yPos);
                } else {
                    ctx.lineTo(xPos, yPos);
                }
            }
            ctx.stroke();

            // 递减函数 (a2*x + b2)
            ctx.strokeStyle = 'red';
            ctx.beginPath();
            for (let x = xMin; x <= xMax; x += 0.1) {
                const y = a2 * x + b2;
                const xPos = padding + (x - xMin) * xScale;
                const yPos = padding + (yMax - y) * yScale;

                if (x === xMin) {
                    ctx.moveTo(xPos, yPos);
                } else {
                    ctx.lineTo(xPos, yPos);
                }
            }
            ctx.stroke();

            // 添加图例
            ctx.font = '14px Arial';
            ctx.fillStyle = 'blue';
            ctx.textAlign = 'left';
            ctx.fillText(`递增函数: y = ${a1.toFixed(1)}x + ${b1.toFixed(1)}`, padding + 10, padding + 20);

            ctx.fillStyle = 'red';
            ctx.fillText(`递减函数: y = ${a2.toFixed(1)}x + ${b2.toFixed(1)}`, padding + 10, padding + 40);

            // 添加标题
            ctx.font = '16px Arial';
            ctx.fillStyle = 'black';
            ctx.textAlign = 'center';
            ctx.fillText('单调递增与单调递减函数比较', canvas.width / 2, padding - 20);
        }
    </script>
</body>
</html>
功能部分:
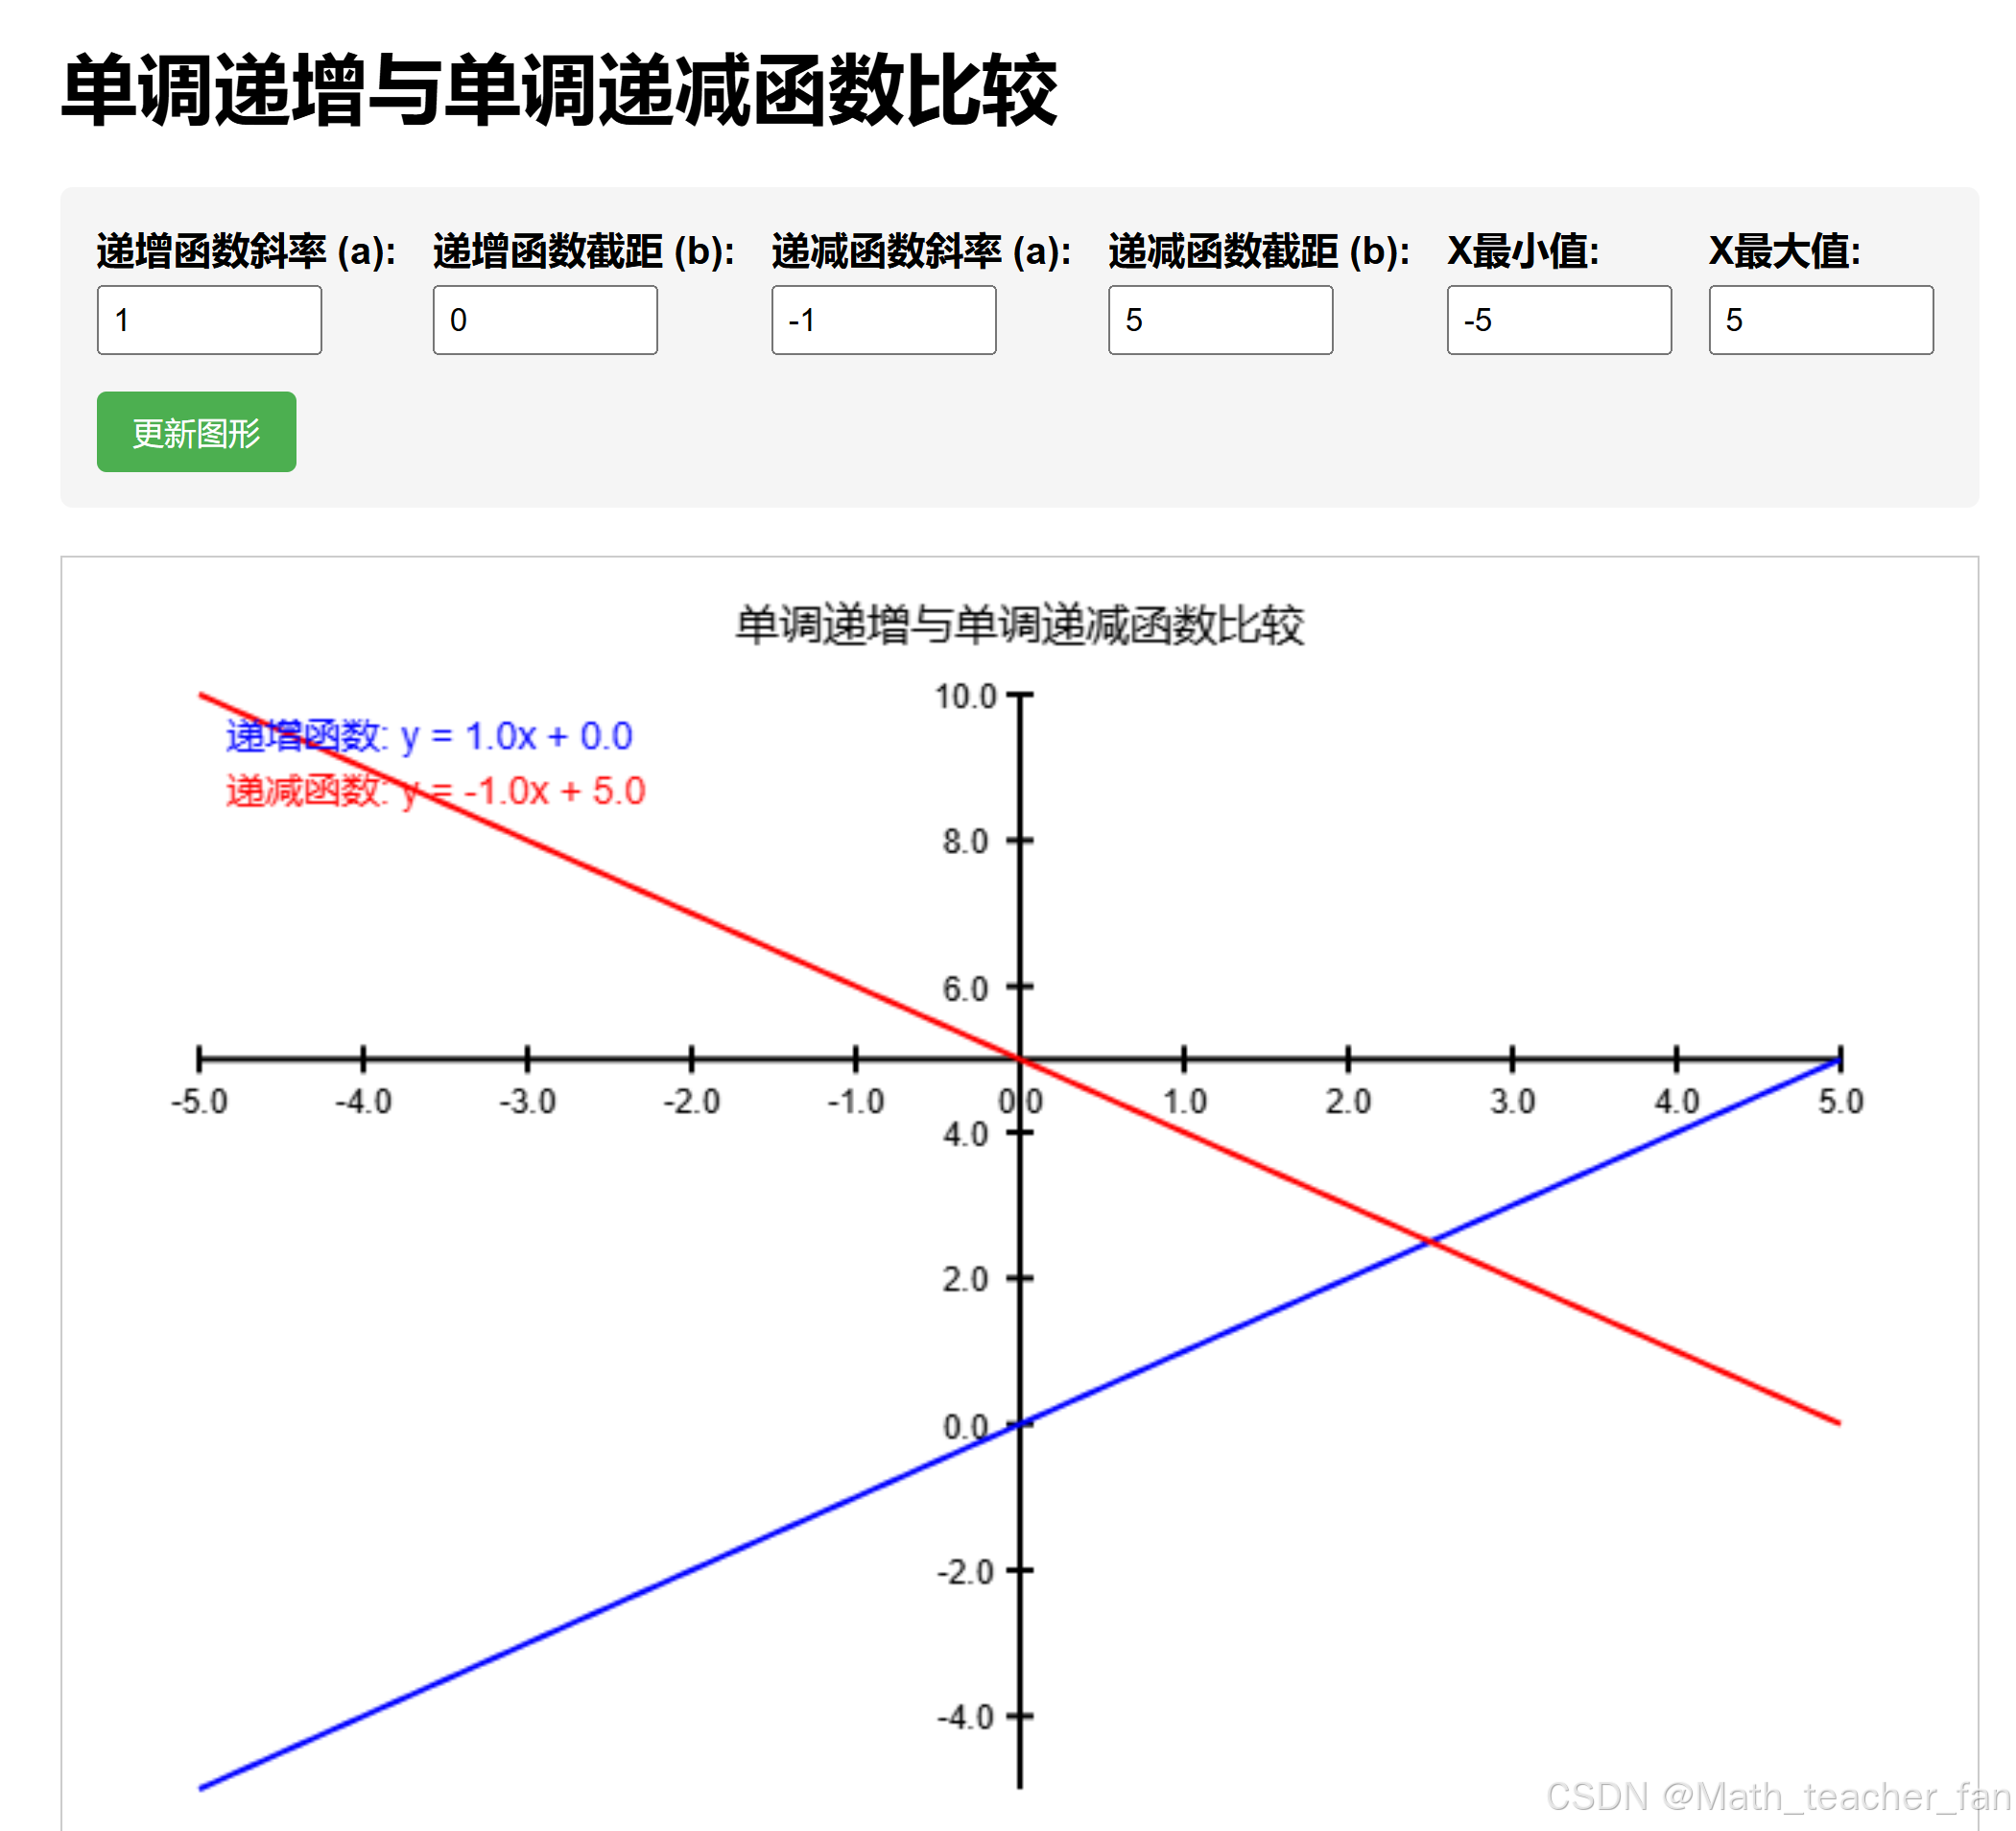
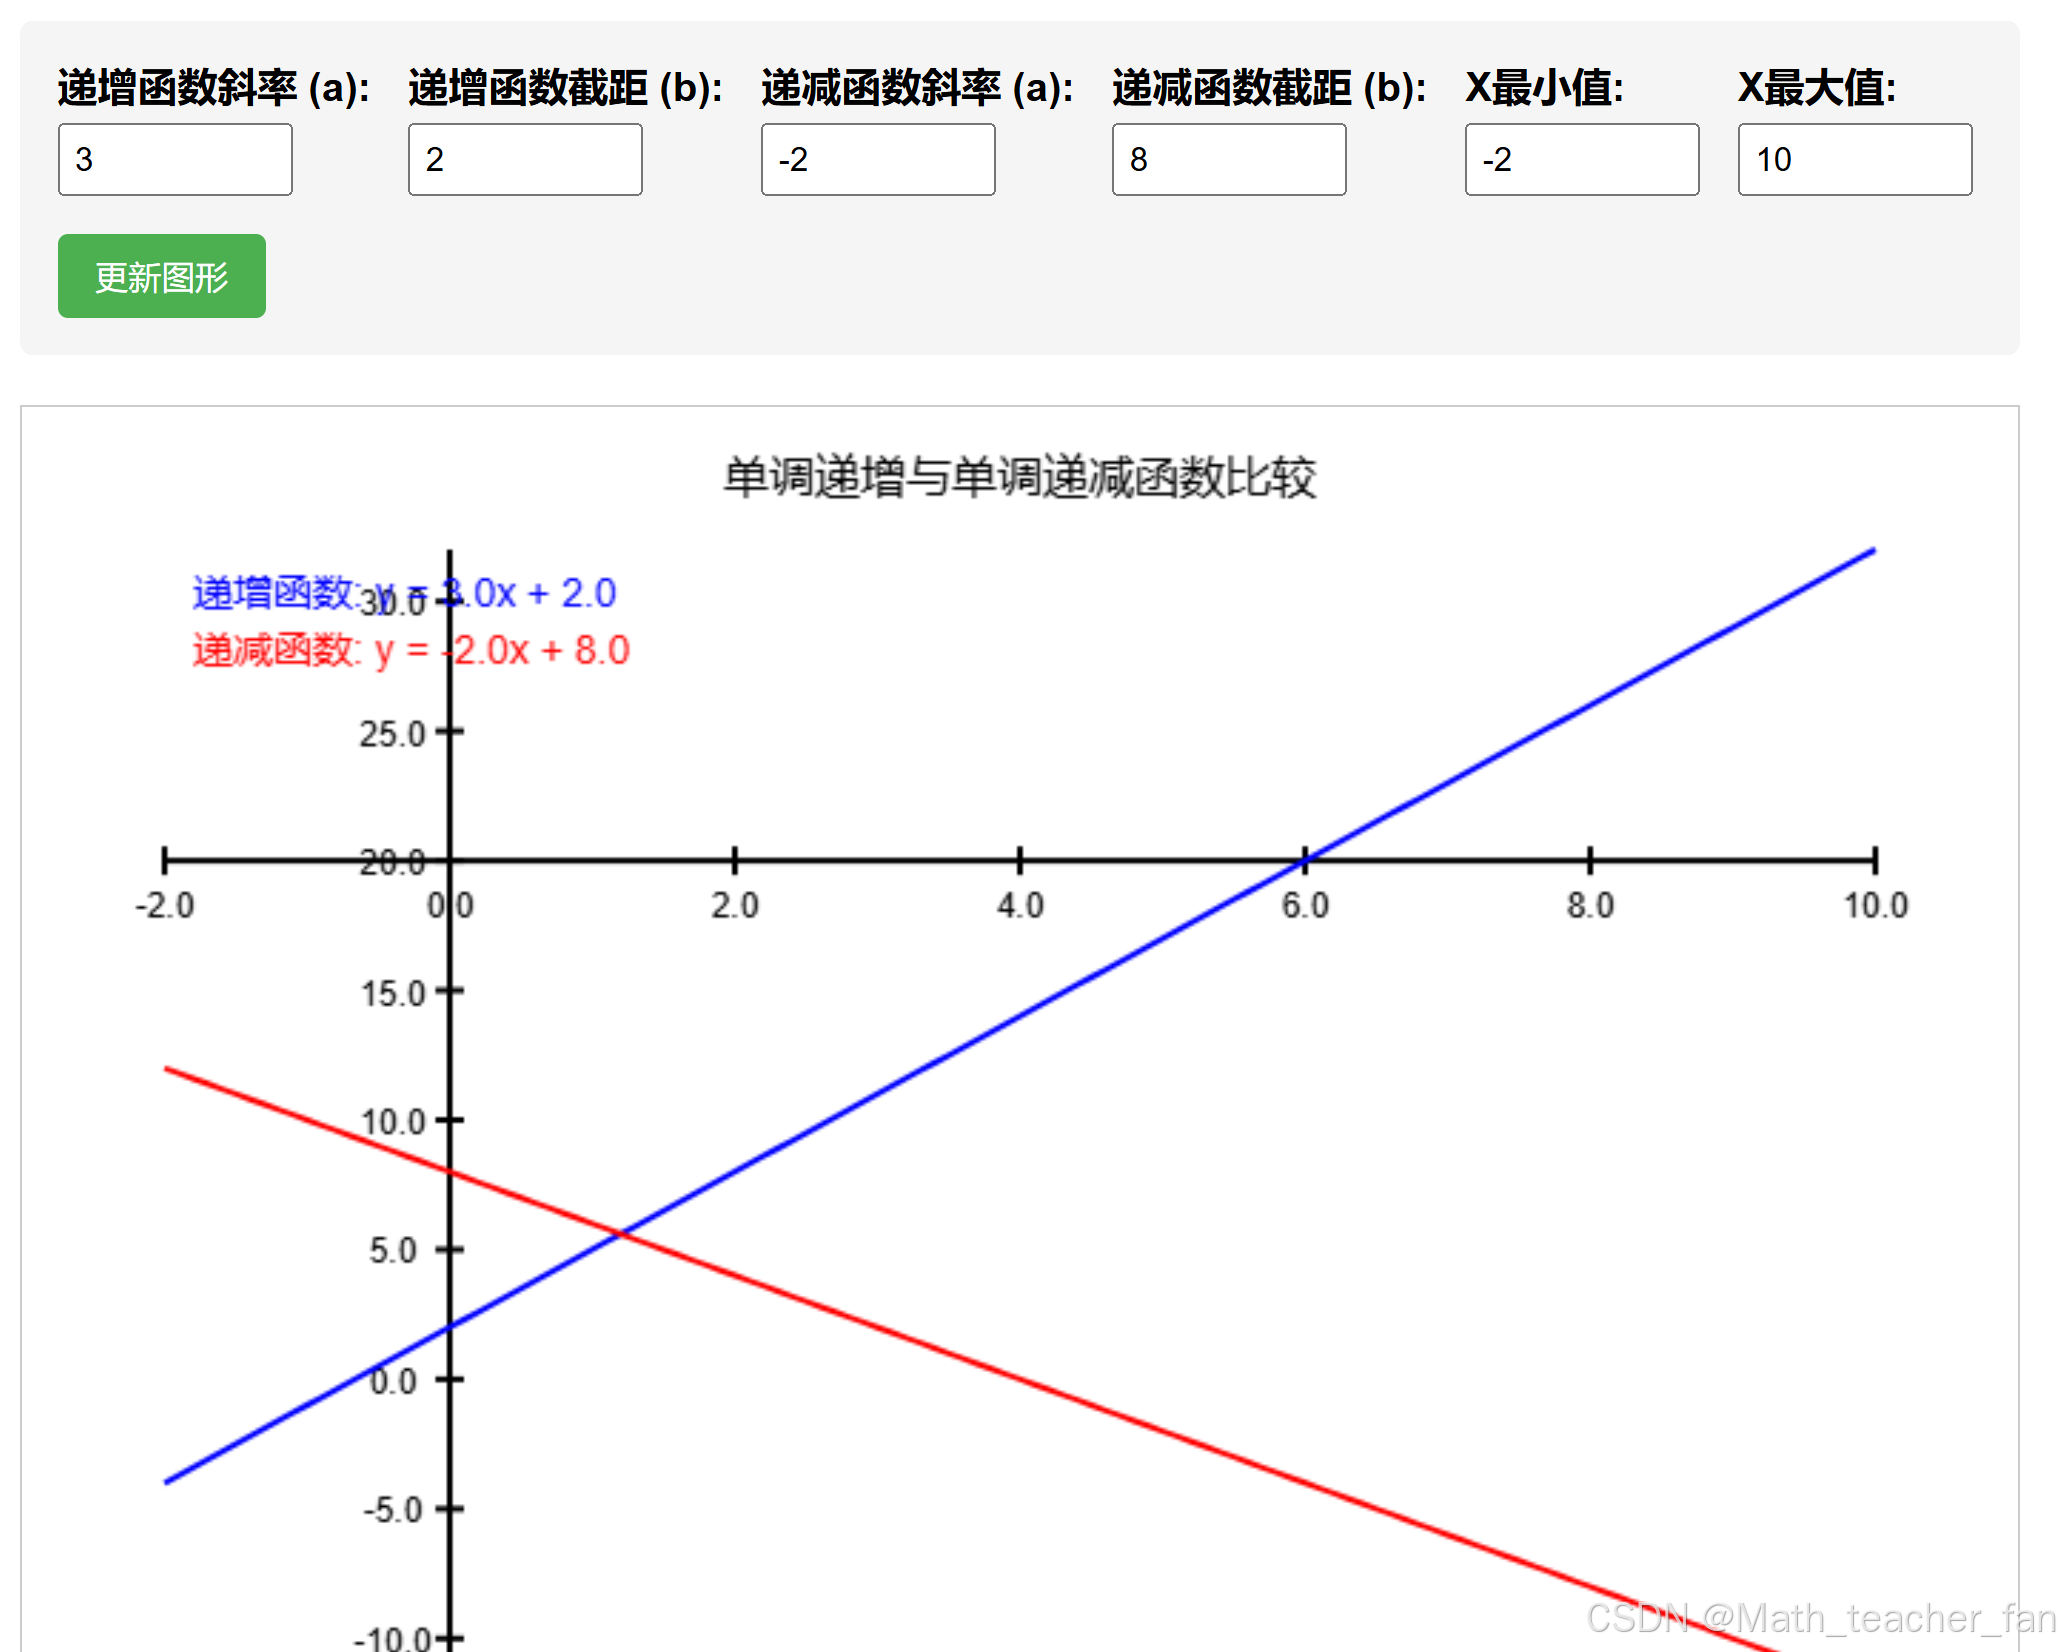
-
控制参数:
-
递增函数: y = a₁x + b₁ (蓝色)
-
递减函数: y = a₂x + b₂ (红色)
-
可以调整X轴的范围(xMin和xMax)
-
-
使用方法:
-
修改输入框中的参数值
-
点击"更新图形"按钮查看变化
-
递增函数的斜率(a₁)应为正数
-
递减函数的斜率(a₂)应为负数
-
-
图形特性:
-
自动调整Y轴范围以适应函数值
-
显示坐标轴和刻度
-
包含图例说明
-
实际效果:
修改值:
对比总结
单从单次询问来说,文心21B的回答效果还是不错的,可以看的出是完全一句提示词的内容生成的,单调递增和递减都有所声明与现实,而DeepSeek则只给出了一个内容,并不完整,这点的优势还是不错的,当然,我们不能完全从一次的返回进行完整的总结,单从效果来说,本次效果对比文心4.5的21B模型获胜。


 834
834

 被折叠的 条评论
为什么被折叠?
被折叠的 条评论
为什么被折叠?
 到【灌水乐园】发言


