


 本文详细介绍了Prometheus的安装步骤及配置方法,包括环境搭建、系统监控、Grafana展示界面优化等内容。
文章目录
一、安装prometheus的步骤
- 安装go 语言环境
- 在监控服务器上安装prometheus
- 在被监控环境上安装export
- 安装grafana
前期准备工作
根据我们自己的业务需求创建安装prometheus的用户和组
我创建www用户和test用户的组
创建www用户
useradd wwww 创建www用户
创建www用户的组test
groupadd test
创建www用户并加入已经创建的test组
useradd -g www test
步骤1:安装go 语言环境
由于Prometheus 是用golang开发的,所以首先安装一个go环境,Go语言是跨平台,支持Windows、Linux、Mac OS X等系统,还提供有源码,可编译安装
linux:https://storage.googleapis.com/golang/go1.8.3.linux-amd64.tar.gz
下载后,上传到要部署的服务器(部署服务器和外网隔离,所以转了一道)。解压缩然后修改配置文件
rz  prometheus-2.24.1.linux-amd64.tar.gz  上传到服务器
tar -xvf prometheus-2.24.1.linux-amd64.tar.gz  -C /usr/local/   将prometheus解压到/usr/local文件夹下
vim /etc/profile  然后编译linux的系统环境变量 将promethues加入到系统的环境变量中
在文件的最后添加
export PATH=$PATH:/usr/local/go/bin

然后运行
source /etc/profile 让配置文件生效
在运行完配置文件后运行 ll yum 等命令 有时候会报错: command is not found
这个时候就是环境变量文件配置出错了我们要手动声明环境变量
export PATH=/usr/local/sbin:/usr/local/bin:/sbin:/bin:/usr/sbin:/usr/bin:/root/bin
然后再修改/etc/profile文件来进行参数的
参考: https://www.cnblogs.com/flyingeagle/articles/9236582.html
Linux修改/etc/profile配置错误command is not found自救方法
go安装好后验证go是否安装成功
go version

出现上面的go的版本信息,既是安装成功
二、在监控服务器上安装prometheus
开始安装prometheus,首先先去官网下载对应系统的版本:https://prometheus.io/download/,
下载对应的linux版本

然后进行文件的上传到linux服务器上
下载后上传到部署的服务器,在服务上执行如下命令解压(root用户,解压到 /usr/local):
tar -xvf prometheus-2.24.1.linux-amd64.tar.gz -C /usr/local/
为了以后进入目录方便,做了一个软连接:
ln -sv /usr/local/prometheus-2.24.1.linux-amd64/ /usr/local/Prometheus
然后进入/usr/local中既可以看到对应的软链接

接下来我们进入/usrlocal/Prometheus 软链接中进行服务的启动和配置
cd /usr/local/Prometheus
2.2、prometheusyaml解析
promtool检查配置文件正确性
- ./promtool check config prometheus.yml
············
2.3、启动prometheus
nohup ./prometheus &

nohup ./prometheus --config.file=/opt/server/prometheus/prometheus.yml --web.enable-lifecycle  >/dev/null 2>&1 &
- 加上 --web.enable-lifecycle 是开启Prometheus 生命周期管理 API,为了后续配置文件更改后不需要停掉prometheus直接就行热更新

prometheus的默认访问端口是9090我们prometheus服务

同步服务器时间
- Prometheus 提示 “Server time is out of sync” 表示服务器的时间与 Prometheus 服务器的时间不一致。时间偏差可能会导致查询结果不准确。要解决这个问题,你需要同步服务器的时间。以下是一些步骤来同步服务器的时间:
Server time is out of sync Detected a time difference of 6h 31m 41.470s between your browser and the server. You may see unexpected time-shifted query results due to the time drift.
---安装 NTP
yum install ntp

---- 启动并使 NTP 服务在系统启动时自动运行:
systemctl start ntp
systemctl enable ntp
---- 查看ntp的状态
systemctl status ntp
-
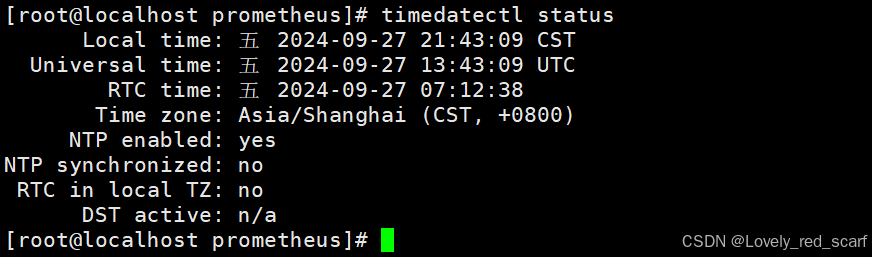
查看当前时间的状态
timedatectl status -
date查看完时间后查看时间不对,然后设置时间同步我用的阿里的
-
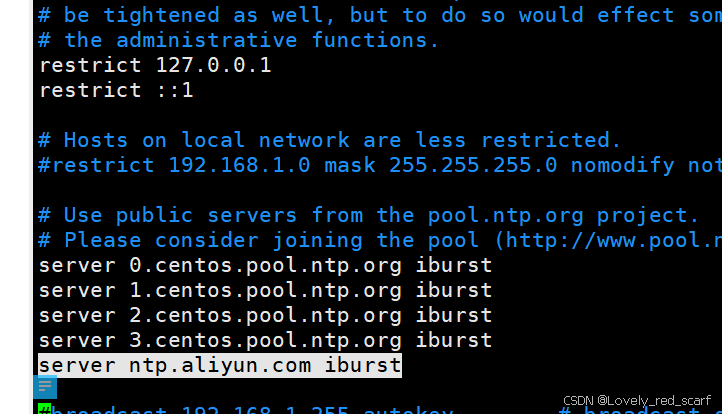
vim /etc/ntp.conf\
-
添加:server ntp.aliyun.com iburst
-
然后重启时间同步 ntp即可
-
systemctl restart ntpd
这个时候我们的promethues还只是什么服务器和服务都没有监控呢 我们要监控其他的服务器要搭配node_export来使用
三、在系统层用作系统监控exporter
安装exporter ,这台linux环境是redhat ip:10.138.108.8,因此用的监控export是node_exporter-0.16.0.linux-amd64.tar.gz ,首先在官网下载这个文件,然后上传到被监控的主机(作为部署服务的主机上也需要安装 export),因此下载并部署后,执行如下命令:
下载node_export
https://github.com/prometheus/node_exporter/releases
tar -xvf node_exporter-1.0.1.linux-amd64.tar.gz -C /usr/local/
然后进入到/usr/local/node_exporter-1.0.1.linux-amd64中启动node_export服务
nohup ./node_export & 默认端口9100启动
nohup ./node_exporter  --web.listen-address=":9101" &  指定端口为9101启动
这个时候就是已经对10.138.108.8这台机器进行了机器的监控我们可以去prometheus中进行此服务器监控的配置就可以获取到监控信息
四、 prometheus配置信息
我们进入安装prometheus的服务器中进行配置文件的修改
4.1、设置全局的标签
global:
  scrape_interval: 15s
  evaluation_interval: 15s
  external_labels:
    env: "production"  # 设置全局标签
- 这段配置的 external_labels 可以添加你想要的标签(例如 env),然后 Prometheus 会自动为所有从不同 job 收集的指标加上这个标签。因此,无论你定义了多少个 scrape job,所有的指标都会带有 env=“production” 这个标签。
进入到prometheus安装目录
cd /opt/server/prometheus

vim prometheus.yml
加入以下配置
  - job_name: 'linux'
    static_configs:
    - targets: ['10.138.108.8:9101']

yml的配置信息修改的时候一定要上下对齐,不可以使用tab键盘,并且yml的所经和上下对齐一定要严格配置,否则启动会报错
修改完配置信息我们再启动prometheus然后让配置生效
修改配置文件后热更新
- 因为启动的时候开启了Prometheus 启用生命周期管理 API,所以可以直接
curl -X POST http://localhost:9090/-/reload
*把更改后的配置文件直接进行热更新
4.2、 对于同一类型的配置可以放在一起
- 比如我的机器有很多,最初是这样写的
scrape_configs:
  # The job name is added as a label `job=<job_name>` to any timeseries scraped from this config.
  - job_name: "prometheus"

    # metrics_path defaults to '/metrics'
    # scheme defaults to 'http'.

    static_configs:
      - targets: ["localhost:9090"]


  - job_name: "192.168.2.210"
    static_configs:
      - targets: ["192.168.2.210:9100"]
    scrape_timeout: 15s  # scrape_timeout 必须小于等于 global--> scrape_interval 的配置


  - job_name: "node_2.208"
    static_configs:
    - targets: ["192.168.2.208:9100"]
但是可以把同一类型的放在一起,起一个相同的job_name就可以了
scrape_configs:
  # The job name is added as a label `job=<job_name>` to any timeseries scraped from this config.
  - job_name: "prometheus"

    # metrics_path defaults to '/metrics'
    # scheme defaults to 'http'.

    static_configs:
      - targets: ["localhost:9090"]


  - job_name: "node"
    static_configs:
      - targets: ["192.168.2.210:9100", "192.168.2.208:9100"]
    scrape_timeout: 15s  # scrape_timeout 必须小于等于 global--> scrape_interval 的配置
通过如下URL可以打开prometheus的自带监控界面: IP:9090,点击targets 跳转到监控目标,这里展现了多个监控对象。红框的表示部署的prometheus


4.3、给不同环境的机器添加标签
  - job_name: "node_export"
    static_configs:
      - targets: ['192.168.2.67:9100', '192.168.2.58:9100']
        labels:
          env: 'fat'

  # dev
  - job_name: "node_export-dev"
    static_configs:
      - targets: ['192.168.2.210:9100', '192.168.2.19:9100']
        labels:
          env: 'dev'
- 同一个任务不同的标签
- job_name: "node_export"  # 统一任务名
  static_configs:
    - targets: ['192.168.2.67:9100', '192.168.2.58:9100']
      labels:
        env: 'fat'  # 通过标签区分环境
    - targets: ['192.168.2.210:9100', '192.168.2.19:9100']
      labels:
        env: 'dev'  # 通过标签区分环境
步骤5:安装grafana 优化展示界面
上面的监控界面是如此的丑我们可以安装grafana 来优化展示界面信息
下面grafana :https://grafana.com/grafana/download
解压安装包
tar -xvf grafana-7.3.7.linux-amd64.tar.gz
然后进入到解压的grafana中进行服务的运行
cd grafana-7.3.7/bin/
./grafana-server  start 运行grafana软件
grafana的默认启动端口是3000
启动后,打开如下URL,端口采用默认的3000,http://10.138.108.9:3000/

输入默认的admin/admin
配置grafana和prometheus
添加Prometheus数据源
Configuration -> Data Sources ->add data source -> Prometheus


新增Dashboard
Create -> import
然后导入展示模板

模板我们可以直接搜索8919

从 https://grafana.com/grafana/dashboards 搜索 相应 dashboards的id如8919,然后load。
选择 Prometheus数据源,最后import。
如果搜索不到我们下载对应模板然后再import即可
查看Dashboard
Dashboards ->Manage

这个时候就完成了grafana和prometheus的结合展示
参考:https://www.cnblogs.com/yqq-blog/p/13712663.html
参考: https://www.cnblogs.com/flyingeagle/articles/9236582.html


 1838
1838

 被折叠的 条评论
为什么被折叠?
被折叠的 条评论
为什么被折叠?
 到【灌水乐园】发言


